
Quick Start Guide
Follow these steps to set up and configure dashboards in NimbusDash using NetSuite. If you are installing NimbusDash for the first time, follow the Bundle Installation guide.
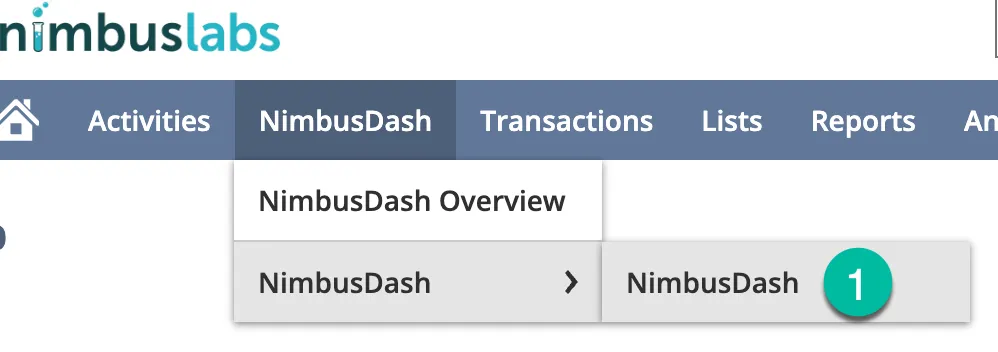
Step 1: Navigate to NimbusDash
Section titled “Step 1: Navigate to NimbusDash”- Locate NimbusDash on the main NetSuite menu bar.
- Click to access the New Dashboard page.
Step 2: Choose a Data Source
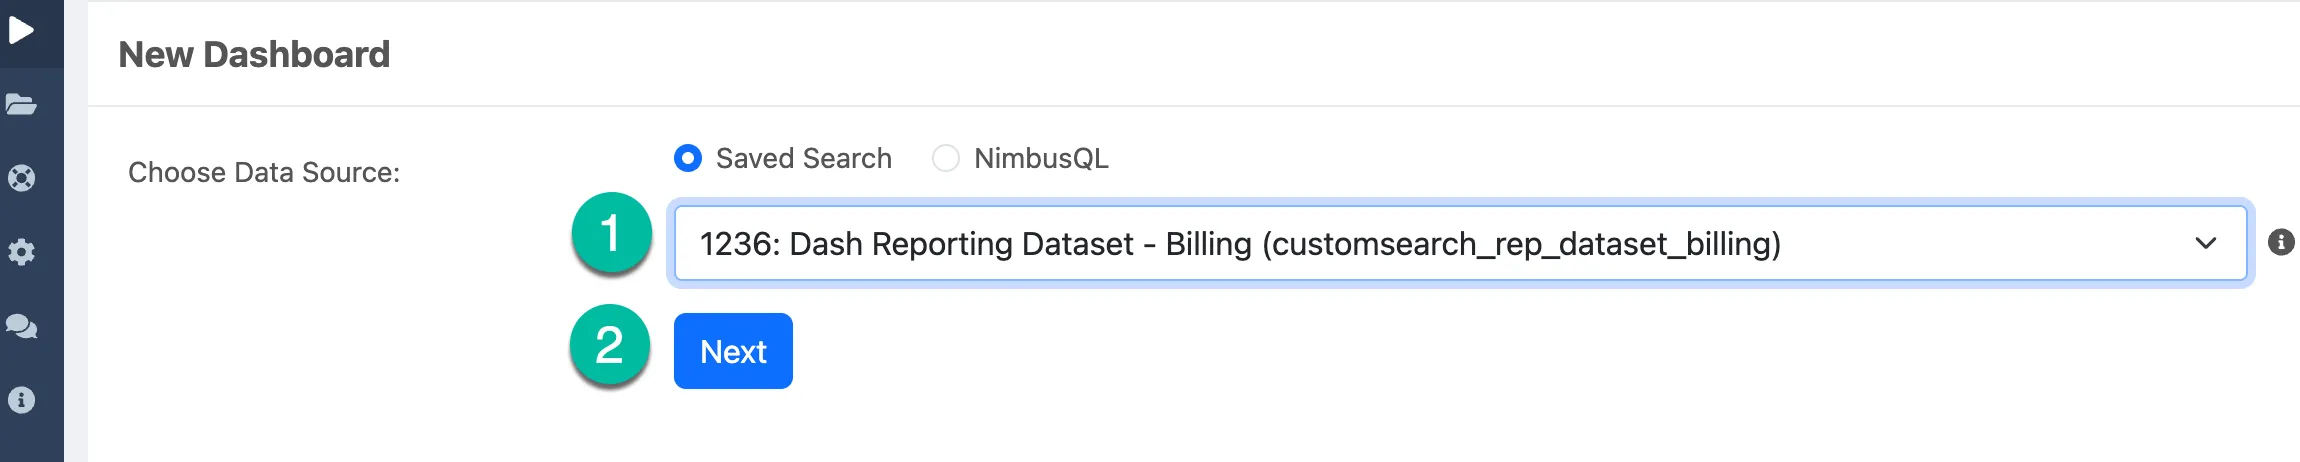
Section titled “Step 2: Choose a Data Source”- Select a data source from the type-ahead list.
- You can choose any Saved Search or NimbusQL query you have access to.
- If you do not currently have NimbusQL installed and would like to use queries as an additional data source, follow the NimbusQL installation instructions.
- Once selected, click Next.
Step 3: View and Interact with the Grid
Section titled “Step 3: View and Interact with the Grid”- The grid will populate with the results of your selected data source.
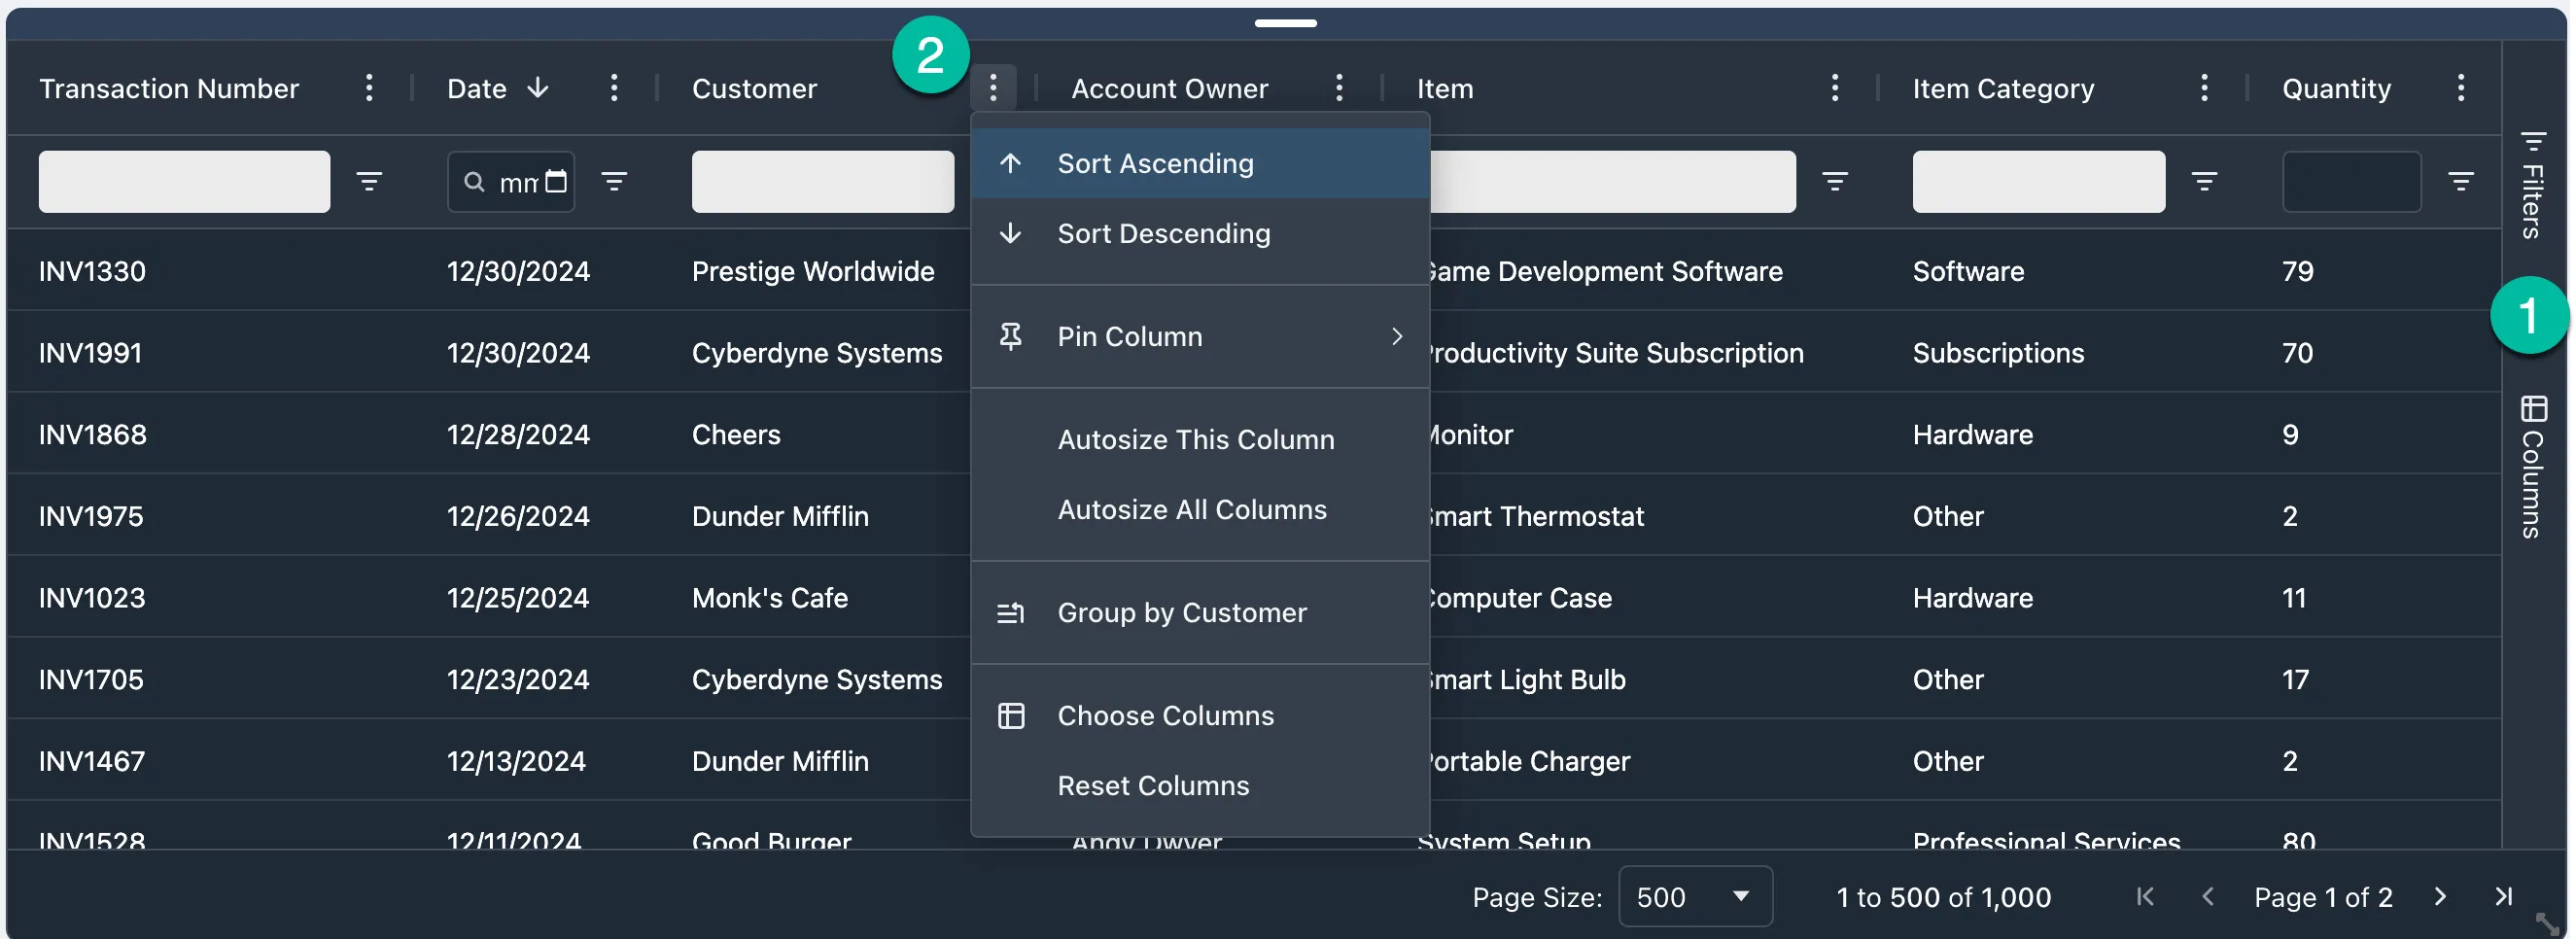
- On the right-hand side of the grid, you will find two tabs:
- Filters Tab: For applying filters to your data.
- Columns Tab: To customize displayed columns.
- Use the 3-dots icon on each column for additional options, including column pinning, field grouping, sorting, and more.
- Click on any column header to immediately sort by that column.
- Use the floating filters under each column header to quickly filter that column.
- Use the expand/collapse icon at the bottom-right of the Grid and Chart widgets to make the portlet bigger or smaller.
For more details on working with the grid, see Grids and Charts.
Step 4: Add a Chart to the Dashboard
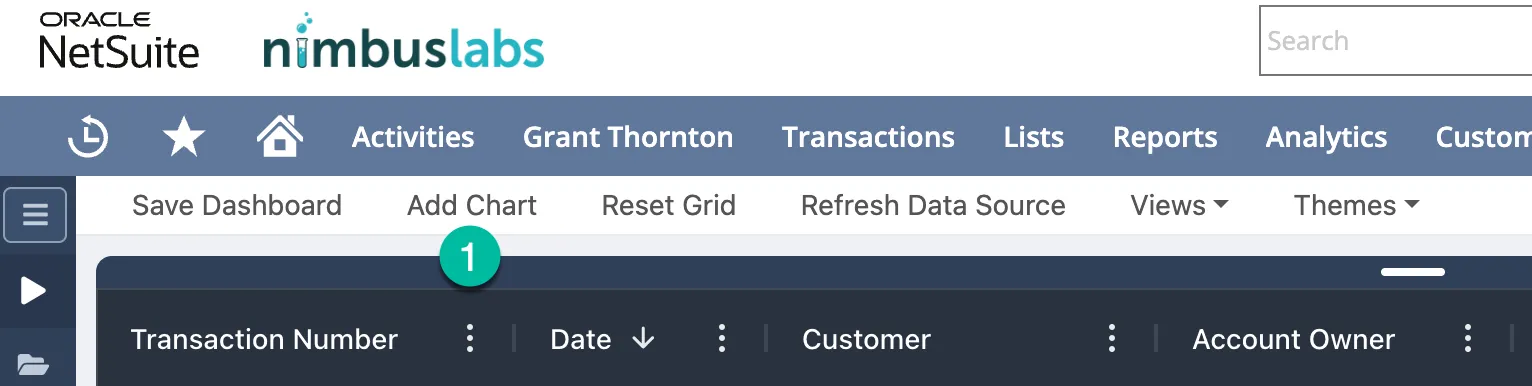
Section titled “Step 4: Add a Chart to the Dashboard”- Use the main menu anchored to the top of the page to configure the dashboard.
- Click the Add Chart button to add a new chart to the page.
- Use the drag bar at the top of each portlet to drag the chart to the desired layout on the page.
Step 5: Configure Your Chart
Section titled “Step 5: Configure Your Chart”Select a Chart Type
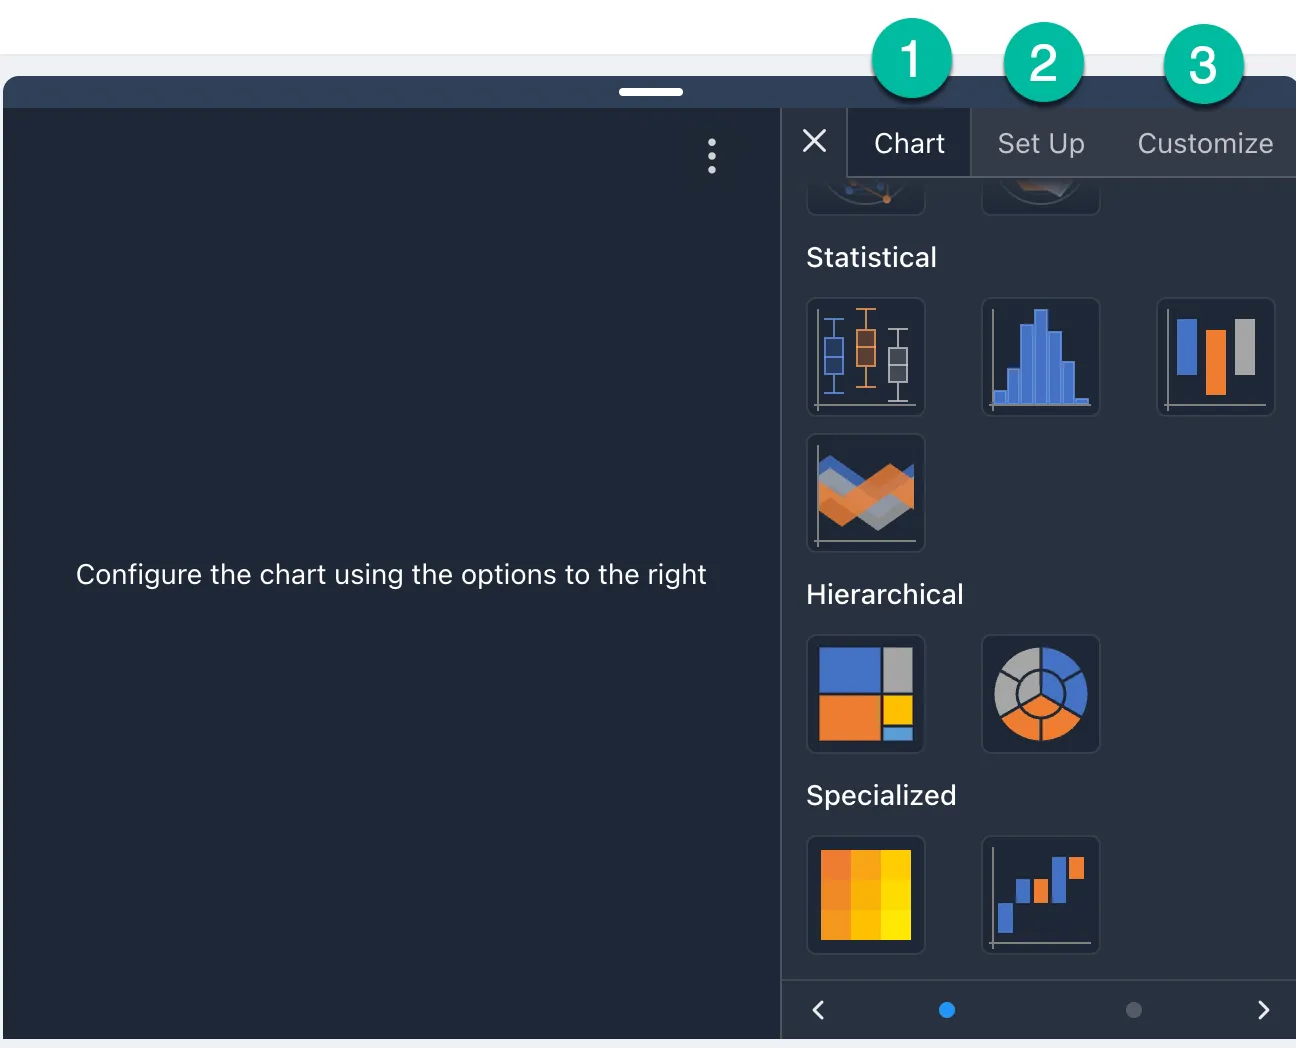
Section titled “Select a Chart Type”- Navigate to the Chart Tab and choose from 24 chart types available.
Set Categories and Series
Section titled “Set Categories and Series”- Go to the Set Up Tab to define your Categories and Series.
- The chart will refresh automatically as you make selections.
Optional Customization
Section titled “Optional Customization”Use the Customize Tab to configure additional options, such as:
- Legends
- Titles
- Axis labels
- Other styling options
Step 6: Save Dashboard
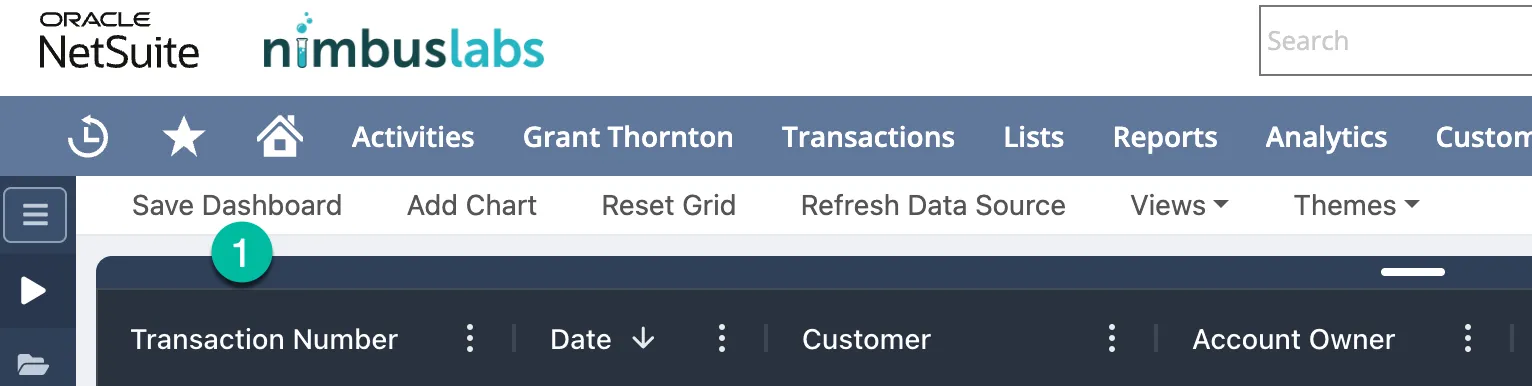
Section titled “Step 6: Save Dashboard”- On the top menu bar, click the Save Dashboard button.
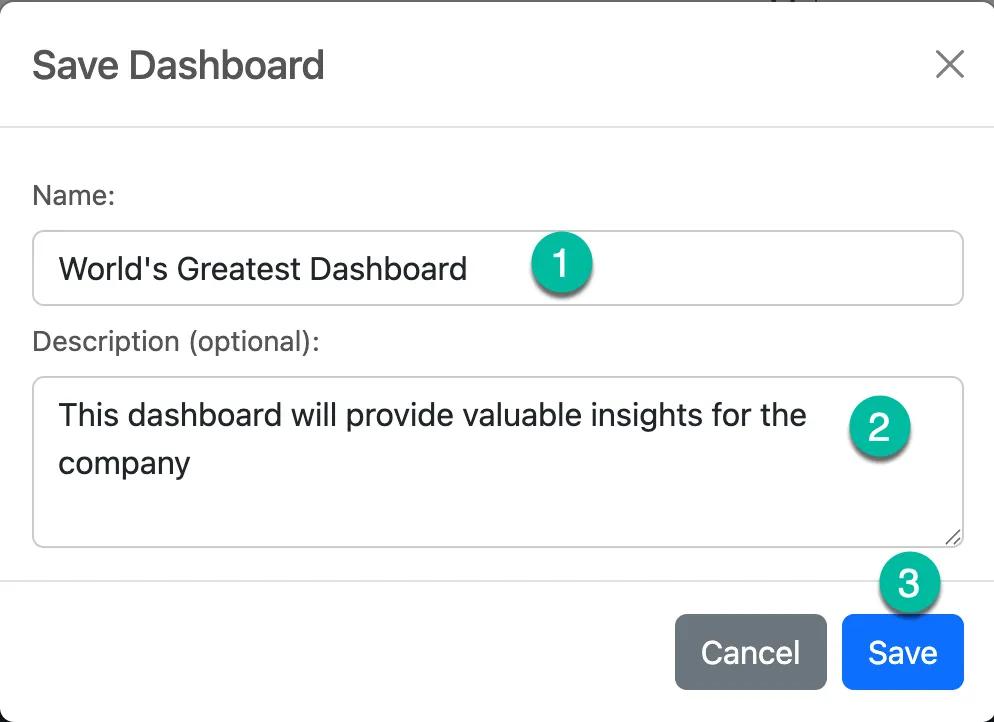
- Provide a Dashboard Name and optional description.
- Click Save.
Step 7: Load an Existing Dashboard
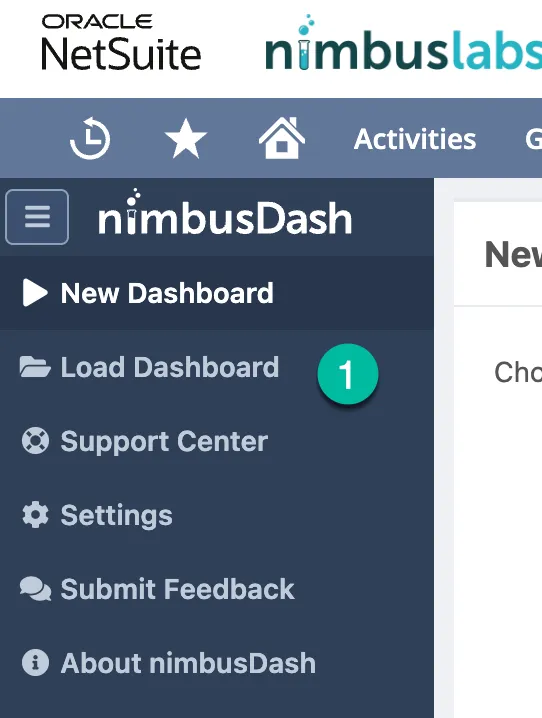
Section titled “Step 7: Load an Existing Dashboard”- Use the left-hand navigation bar, clicking on the Load Dashboard option (folder icon).
- A grid will display with all dashboards you have access to.
- Click on the dashboard name to open that dashboard.

By following these steps, you can efficiently create and customize dashboards in NimbusDash to suit your reporting needs.