Configuring Charts in NimbusDash
Charts are configured in NimbusDash by using the three tabs in the Edit Chart menu, accessed by clicking the 3-dots on the top-right of the chart. These three sections are labeled Chart, Set Up, and Customize.
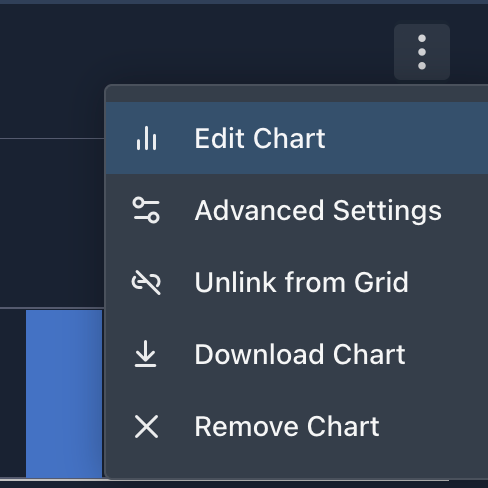
In addition, there are additional options in the 3-dots menu for Advanced Settings, Unlink from Grid, Download Chart, and Remove Chart.
Important: Use the resize icon on the bottom-right of any dashboard element (Grid and Charts) to resize that widget
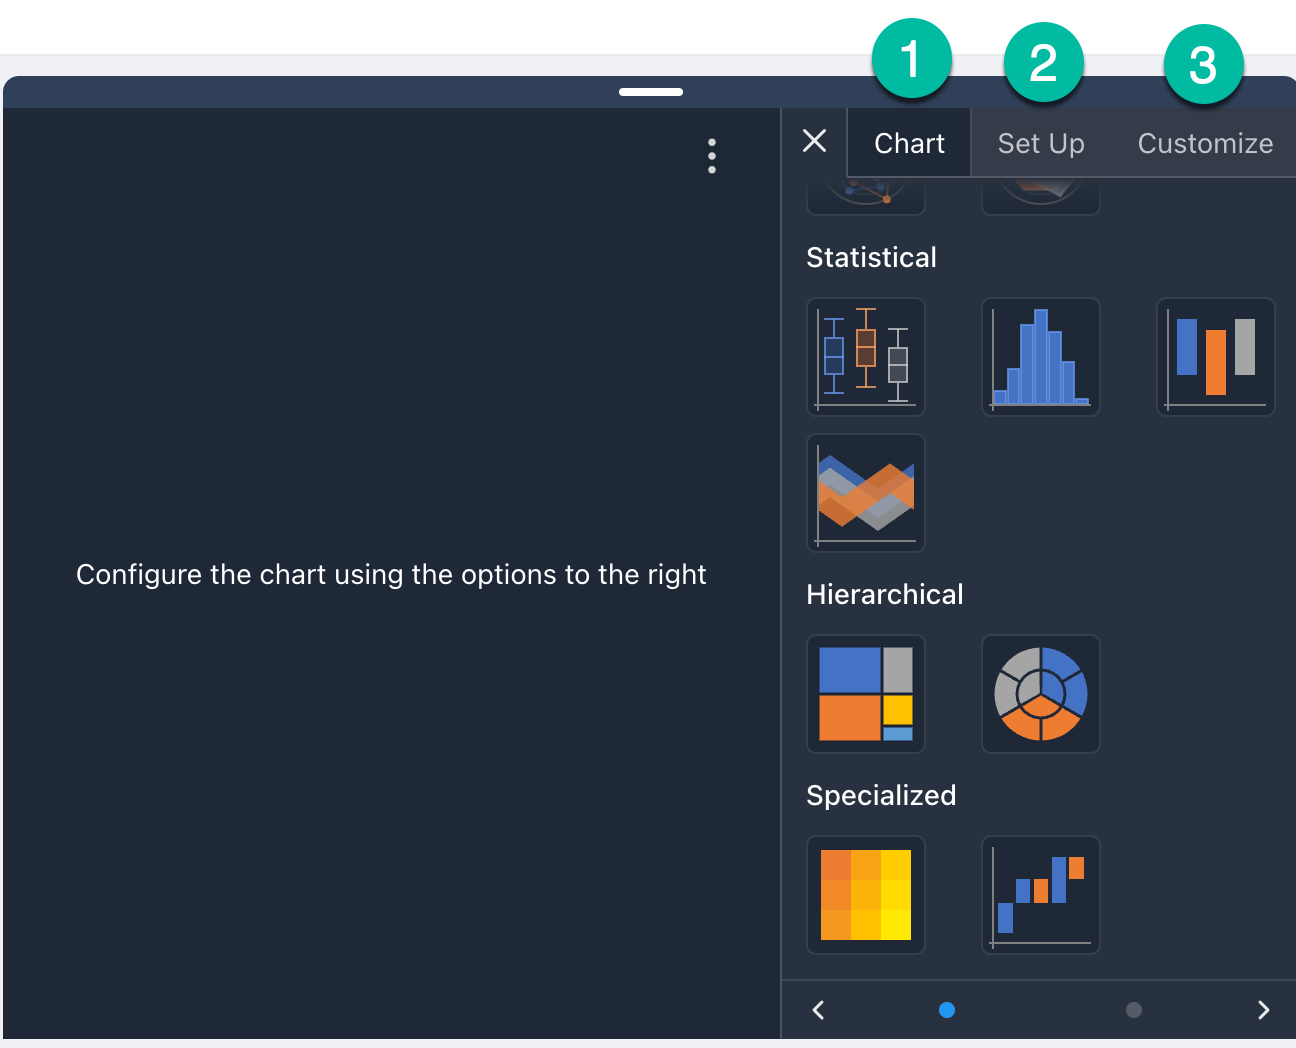
1. Chart Tab
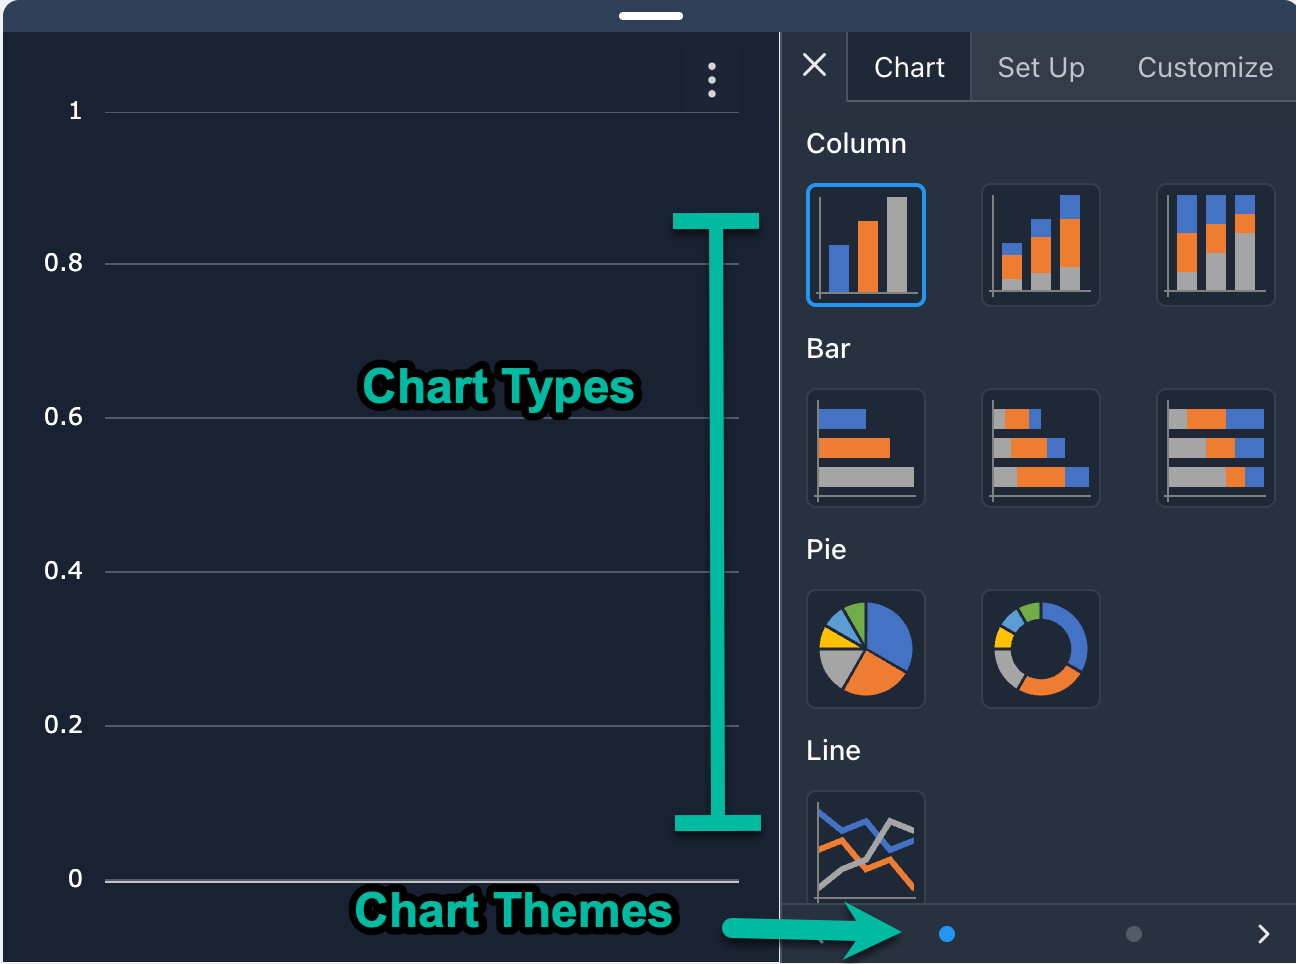
- The chart tab has all of the available chart types (25+) that are available in NimbusDash.
- These include standard types such as Bar, Column, Line, Area as well as less common types such as Polar, Hierarchical, Polar, Statistical, Heat Maps, Step Charts, and more.
- Choose the appropriate chart type and then proceed to the Set Up tab. You can always come back to this tab if you want to change the chart type.
- Below the list of chart types are chart themes, which currently allow both Dark and Light modes.
2. Setup Tab
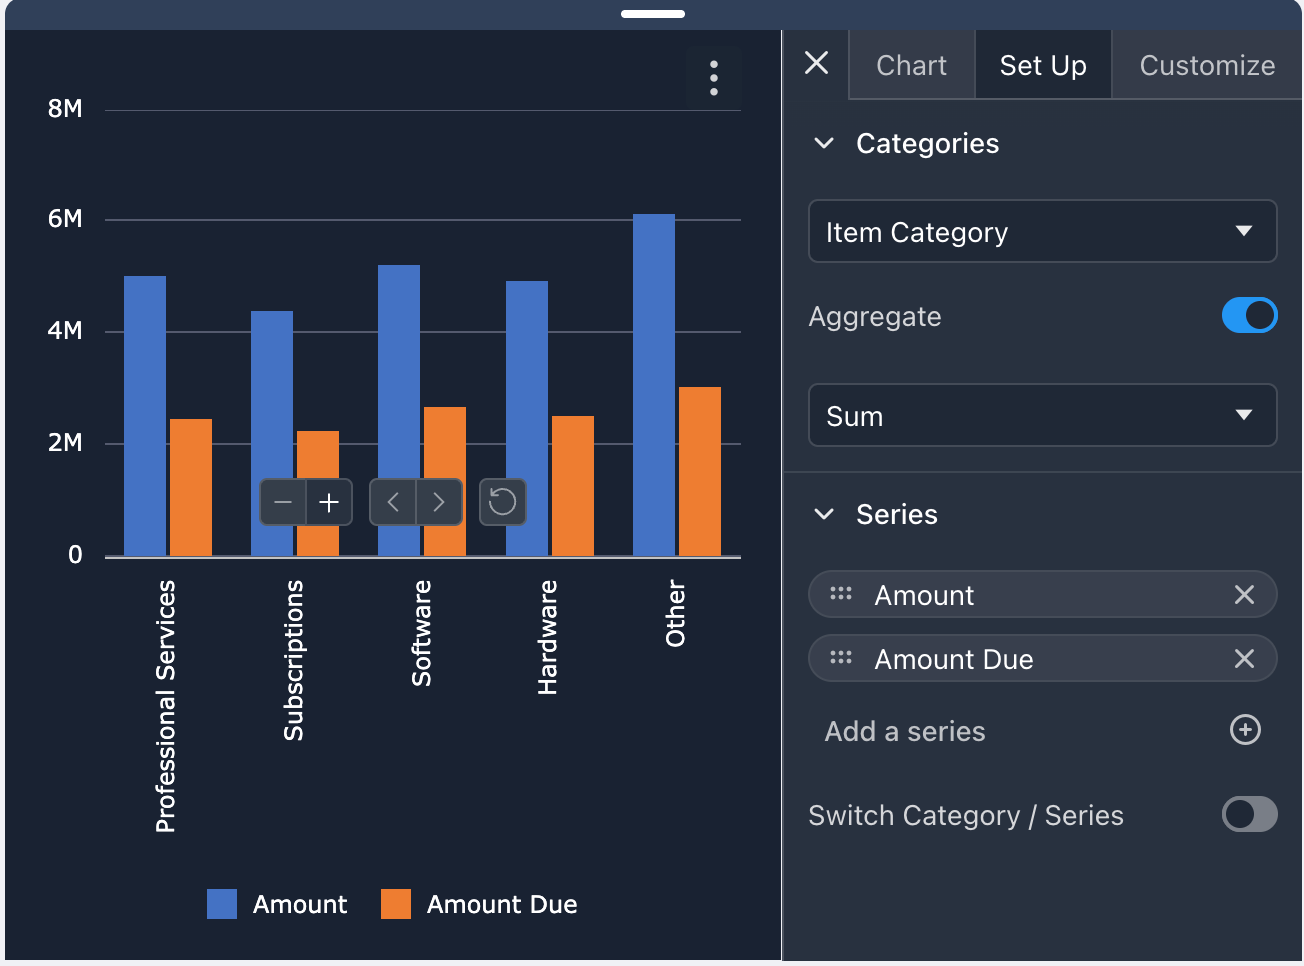
- The setup tab is where you will choose the data you would like to display for this chart, primary split up between Categories and Series
- Categories
- These are the dimensions you will segment the data by. For example, Year, Quarter, Account Manager, Sales Rep, Subsidiary, Department, etc
- Some chart types can have multiple categories
- Series
- These are the metrics that will be aggregated based on the category you select. These are generally number attributes, such as Amount, Quantity, Counts, etc
- Some chart types can have multiple categories
- Categories
- The data can be configured to aggregate based on the selection in the Aggregate field (Sum, Count, Max, Min, etc)
3. Customize Tab
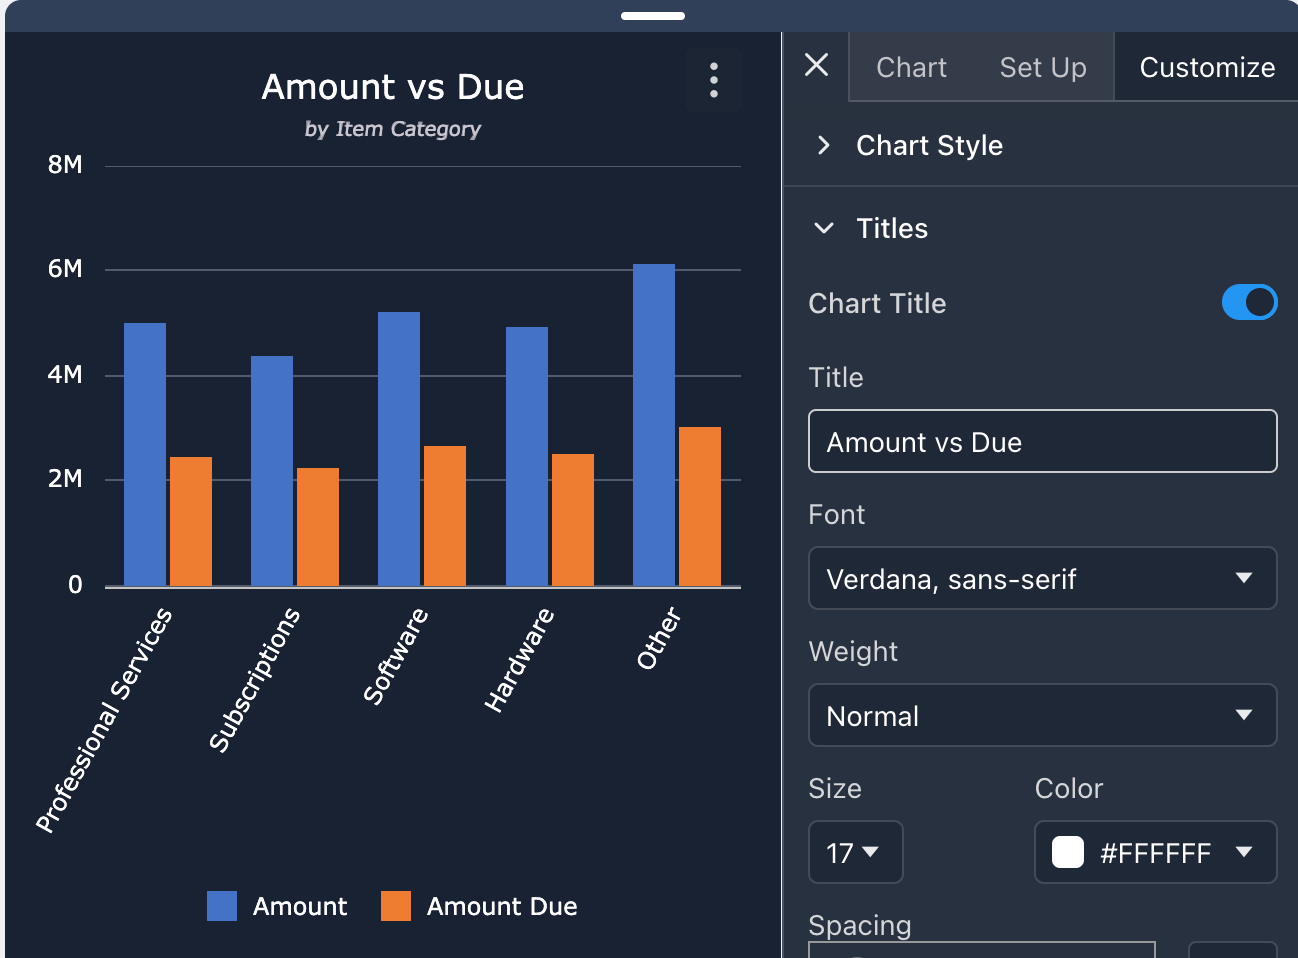
- The customize tab contains all of the chart styling options, allowing extensive functionality to format the look-and-feel of the chart, including the colors, fonts, titles, axis labels, rotation, and more.
- Expand the section for each of the chart customization options to see the available options. Changes you make are immediately applied to the chart
3-Dots Menu for Additional Options
4. Advanced Settings
- Using the 3-dots menu at the top-right of the chart, choose the Advanced Settings for additional options, which include Navigator, Zoom, and Crosshair options
- Navigator
- This enables a drag bar at the bottom of the chart to allow focusing on specific portions of the chart.
- You can also enable a mini-chart, which will display the full chart in the navigator bar. This allows for seeing the full chart in the navigator bar while you focus on specific sections in the main chart
- Zoom
- The zoom option allows for enabling chart selection or scrolling, which will let you use your mouse or scroll wheel to zoom in and out of certain chart sections
- Crosshair
- The crosshair option will display a horizontal/vertical option when hovering over the chart.
- You can choose whether to snap the crosshair to key points of the chart or to use free-form cross hair, which will not snap the focus to the next point

5. Unlink from Grid
- By default, all charts are “linked” to the grid containing the data that is part of the dashboard. This means that when filters are applied, they update all charts linked to the grid.
- The Unlink from Grid option is a powerful feature that lets you remove a specific chart from being linked to the grid.
- This allows for defining specific filters in your grid for that specific chart, which will be unaffected by additional filtering done to the grid
- For example, you can use this function to create two separate charts, showing Sales for Team A, Category X in one chart and Sales for Team B, Category Y in another chart on the same dashboard
- To use this function
- Filter the grid to the data you would like to see.
- Then, build the chart using Steps 1-3 above.
- Once you are satisfied with the chart and filters, click the Unlink from Grid button.
- When reloading the dashboard in the future, the filters that were applied to this chart will be re-applied, producing the correct output but remaining unlinked from the grid
6. Download Chart
- Clicking the Download Chart button will download a PNG of the chart to your machine, using the current title of the chart as the file name
7. Remove Chart
- Clicking the Remove Chart button will remove that chart from the dashboard
Additional Information
- Drag the charts and grid anywhere you would like on the page.
- At any point during the setup and configuration of the chart, simply click the X next to Chart to close the configuration menu, which will expand the chart to take up the full width of the container
