Next-Level Analytics for NetSuite – No Extra Tools Needed
Next-Level Analytics for NetSuite – No Extra Tools Needed
Easily Build Dashboards
Create a dashboard in minutes, using data from either a saved search or saved SuiteQL query. Add multiple charts across 25+ chart types on the same dashboard, allowing multiple points of analysis on the same screen. Customize the chart look-and-feel, using 10 preset color schemes and a host of options for titles, size, fonts, and other chart presentation options.
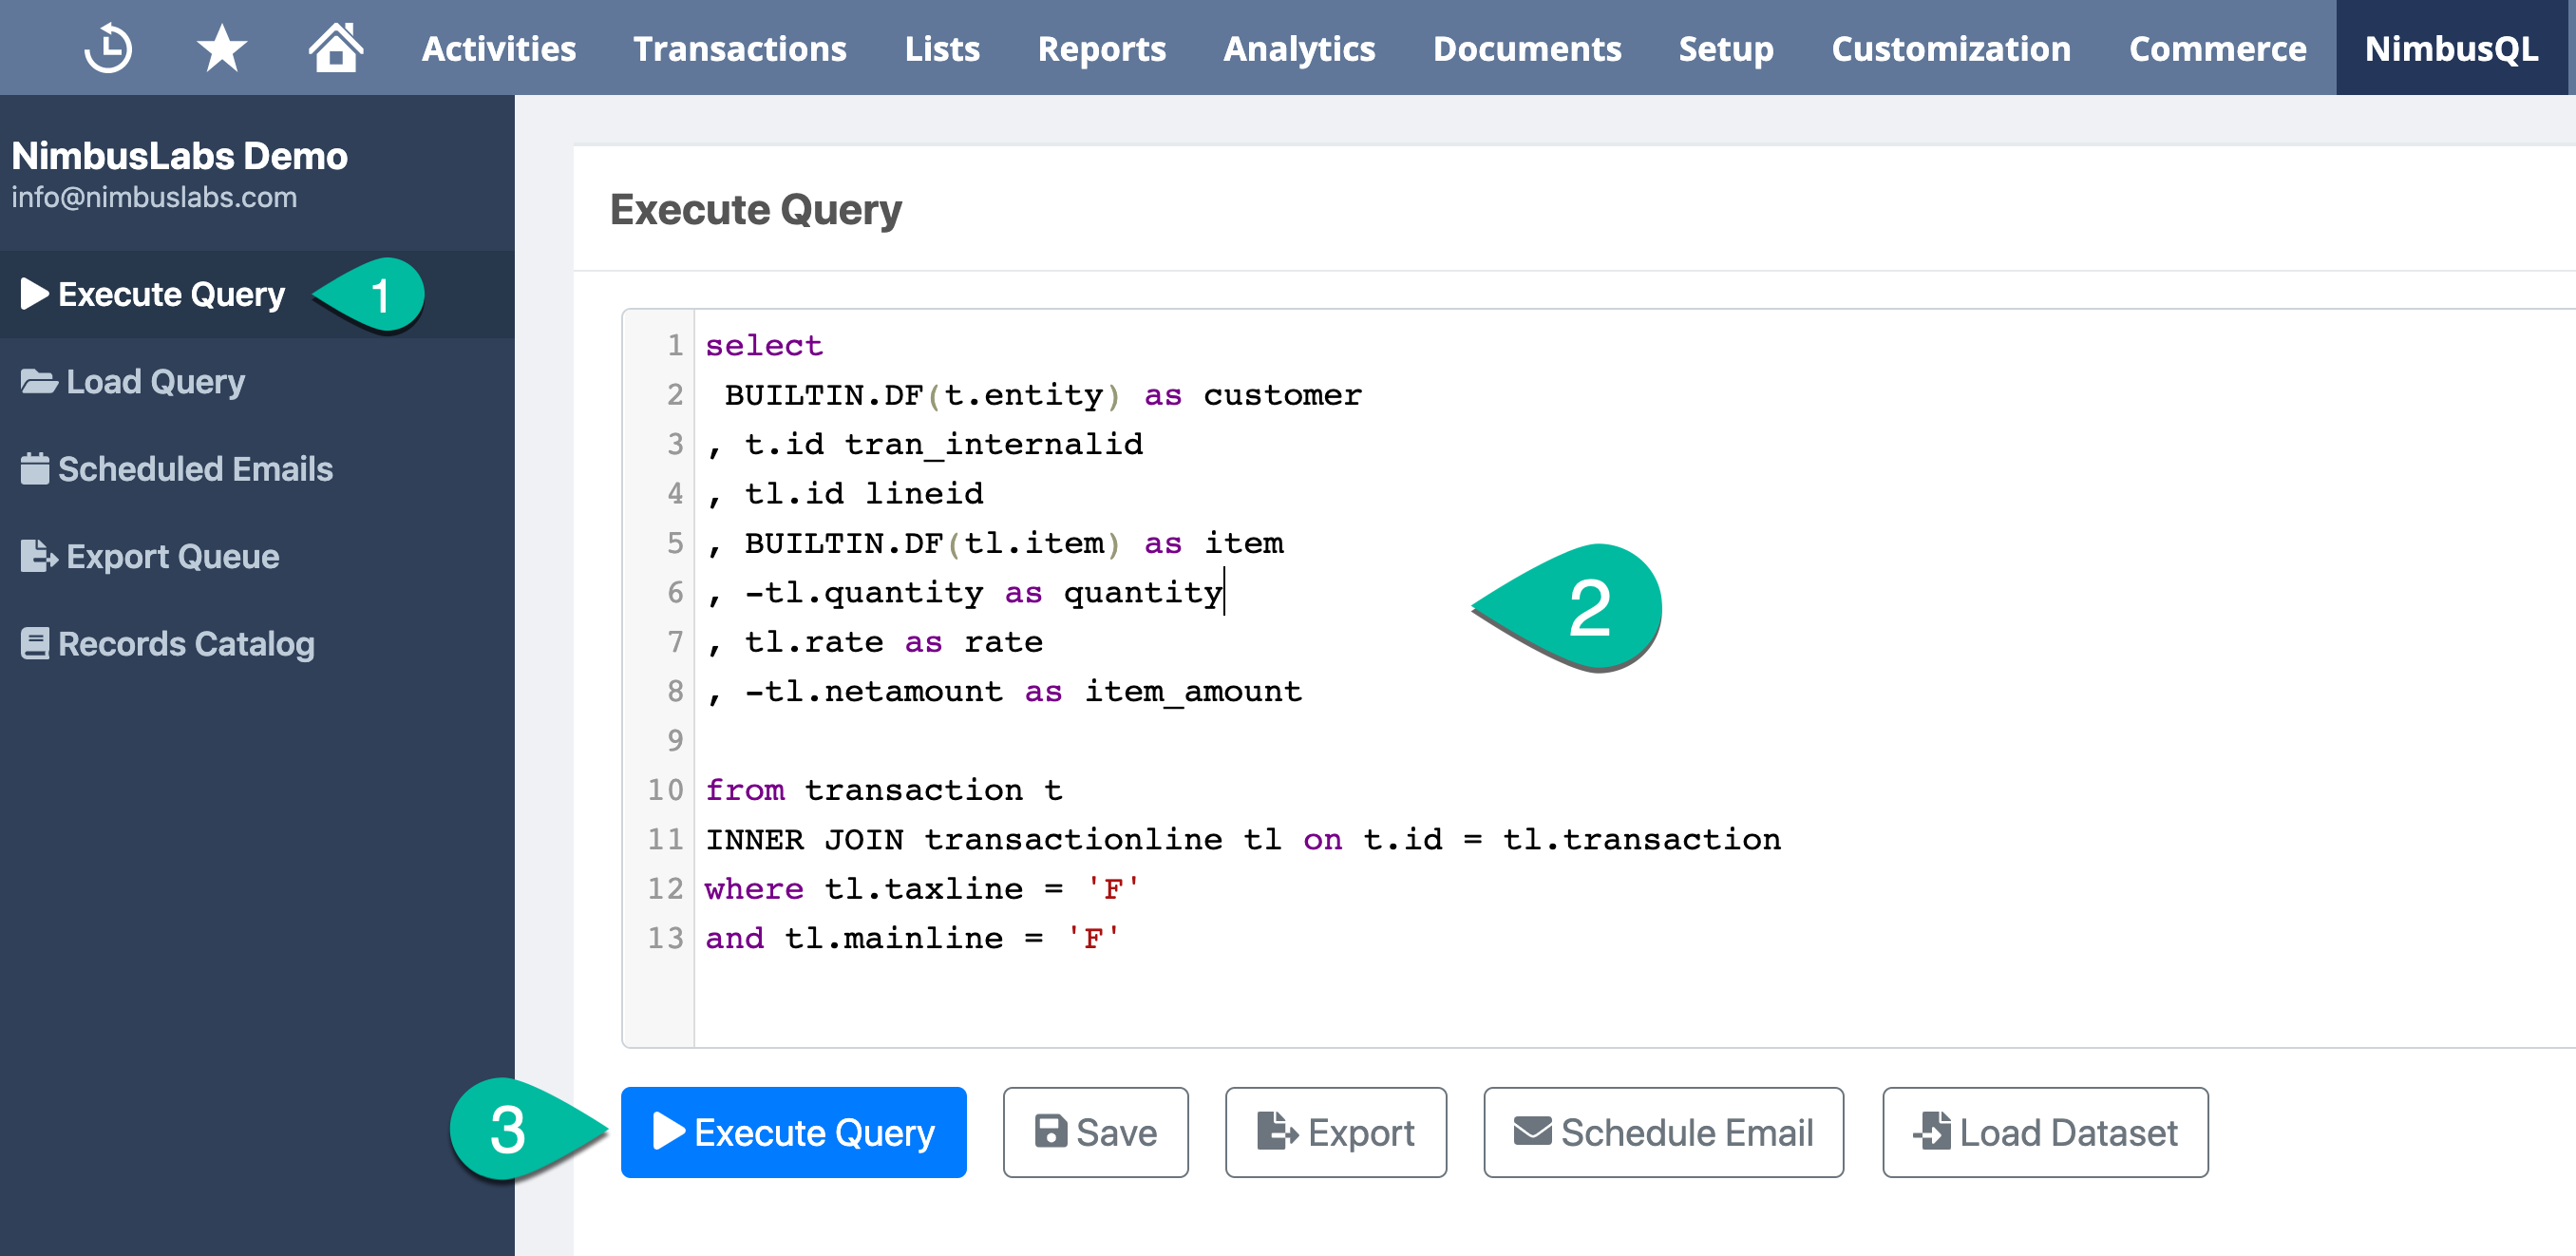
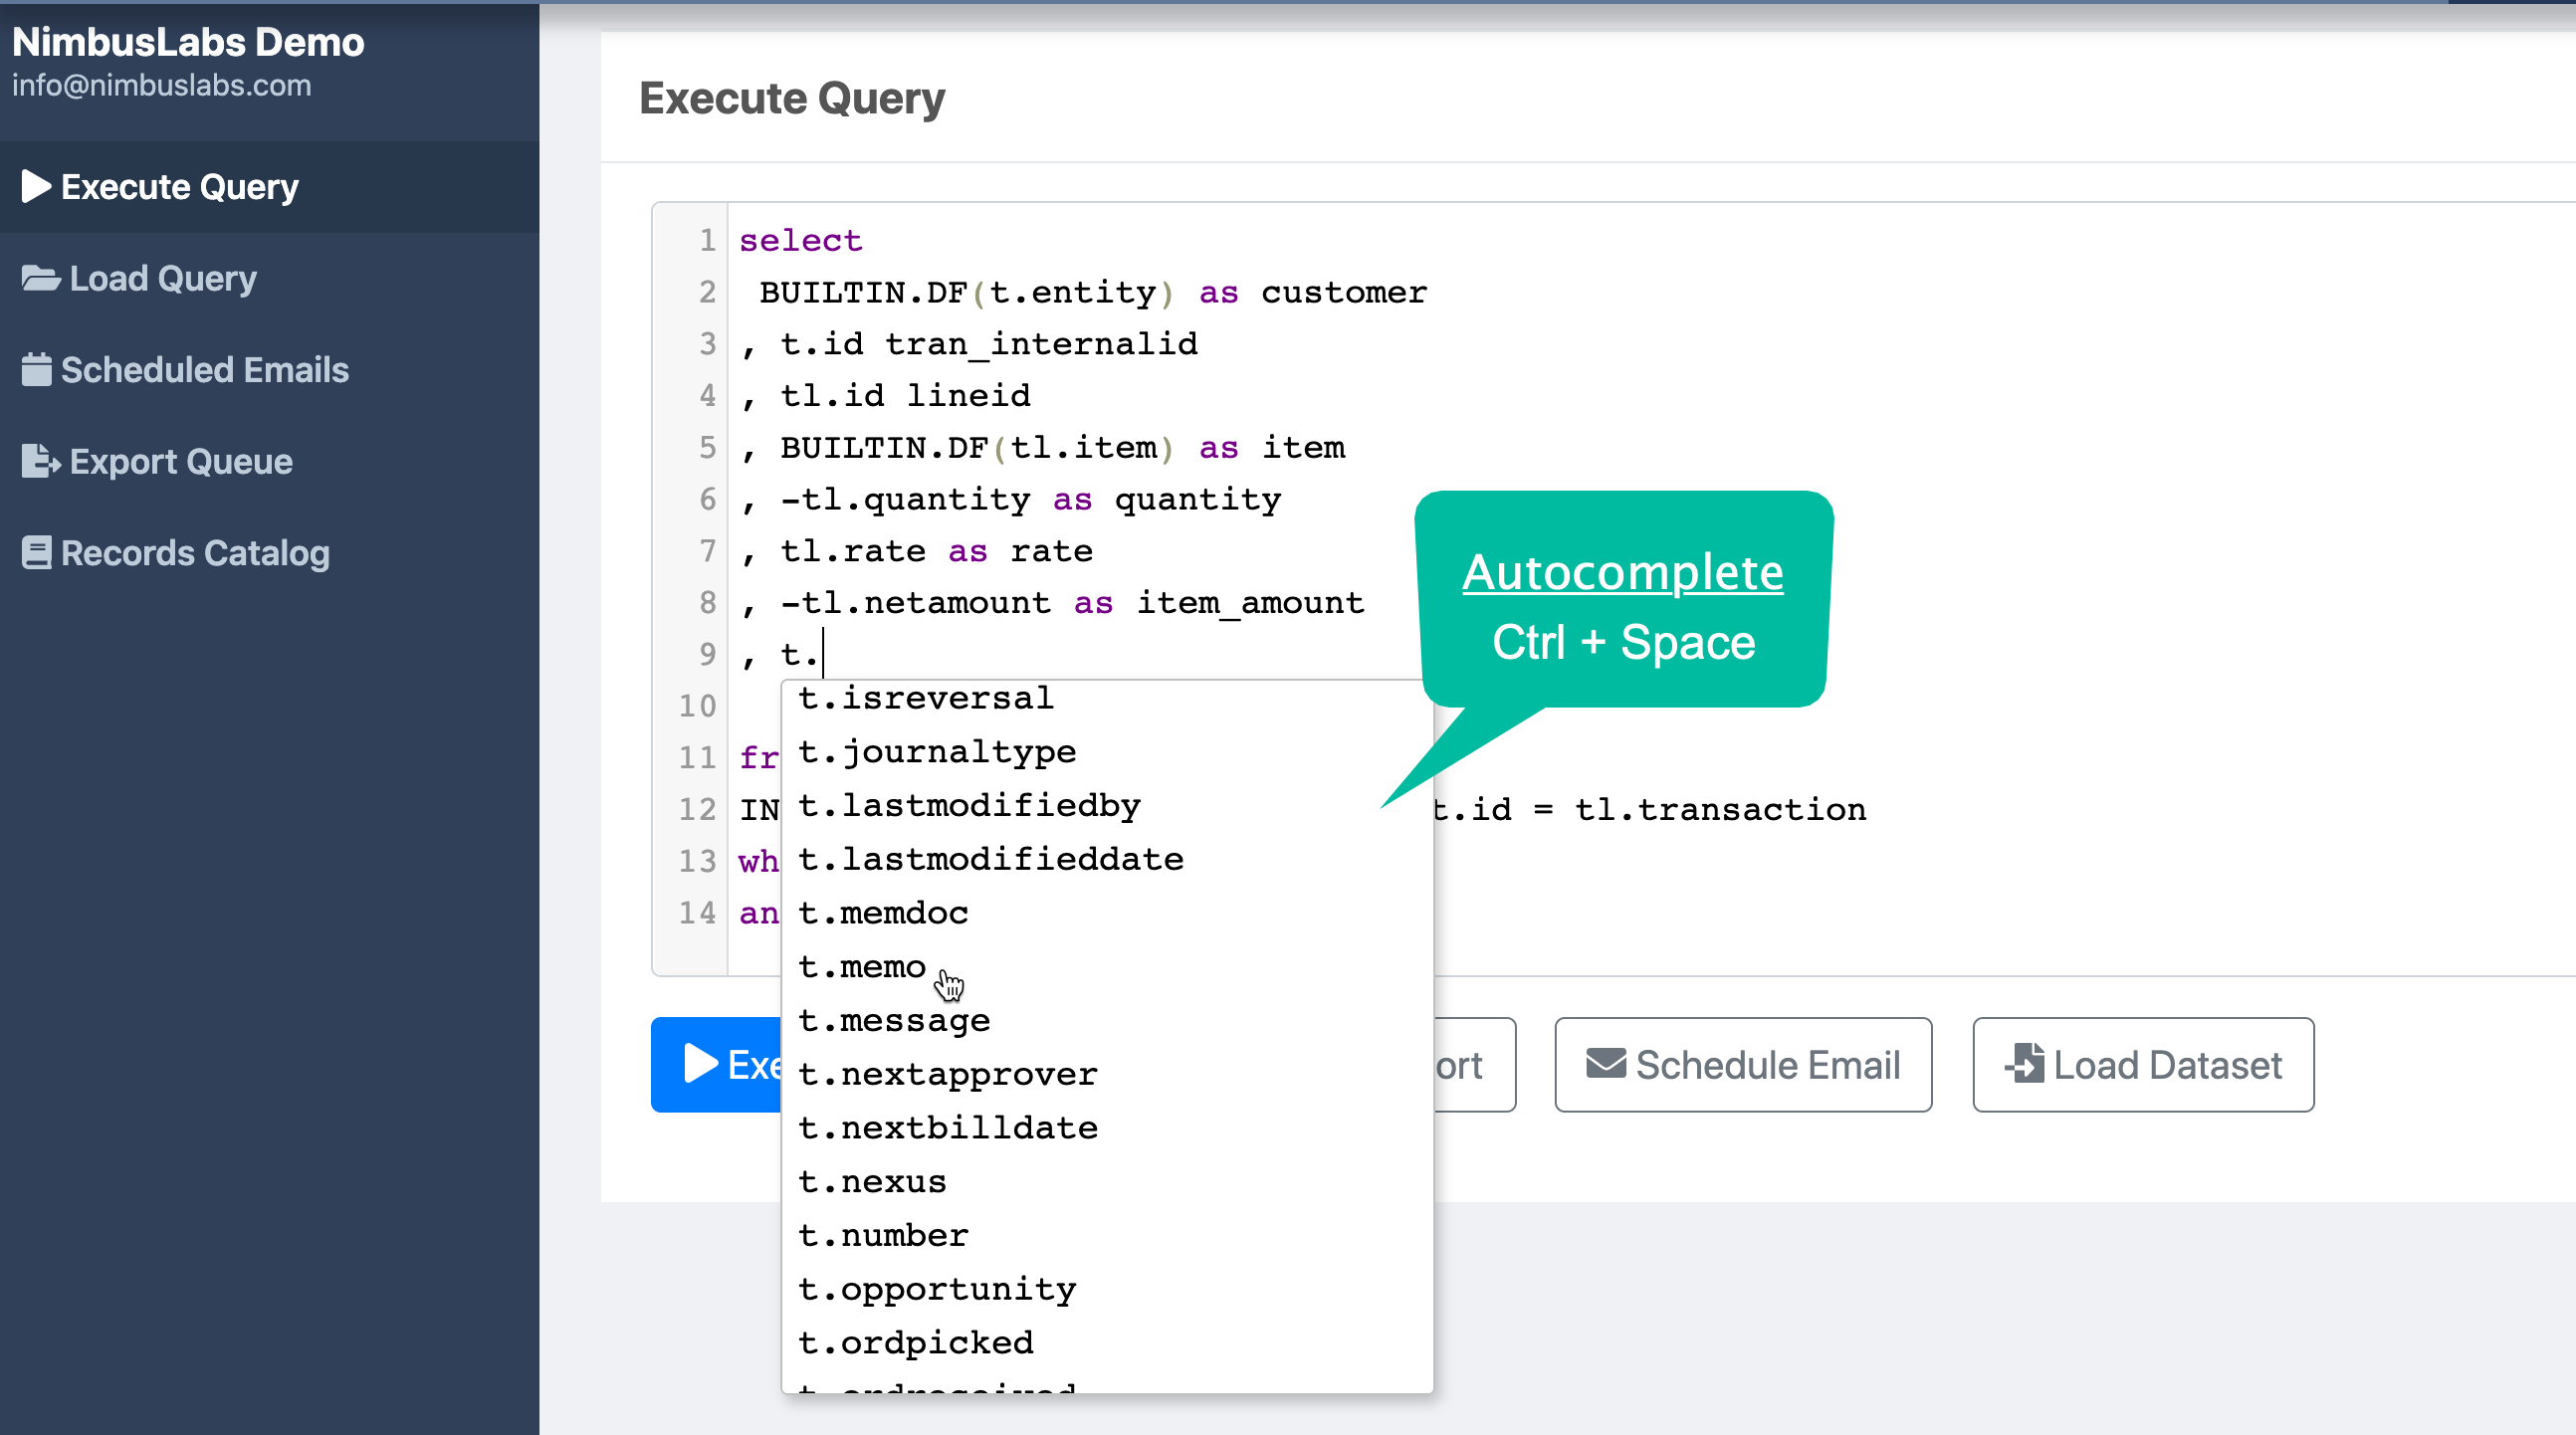
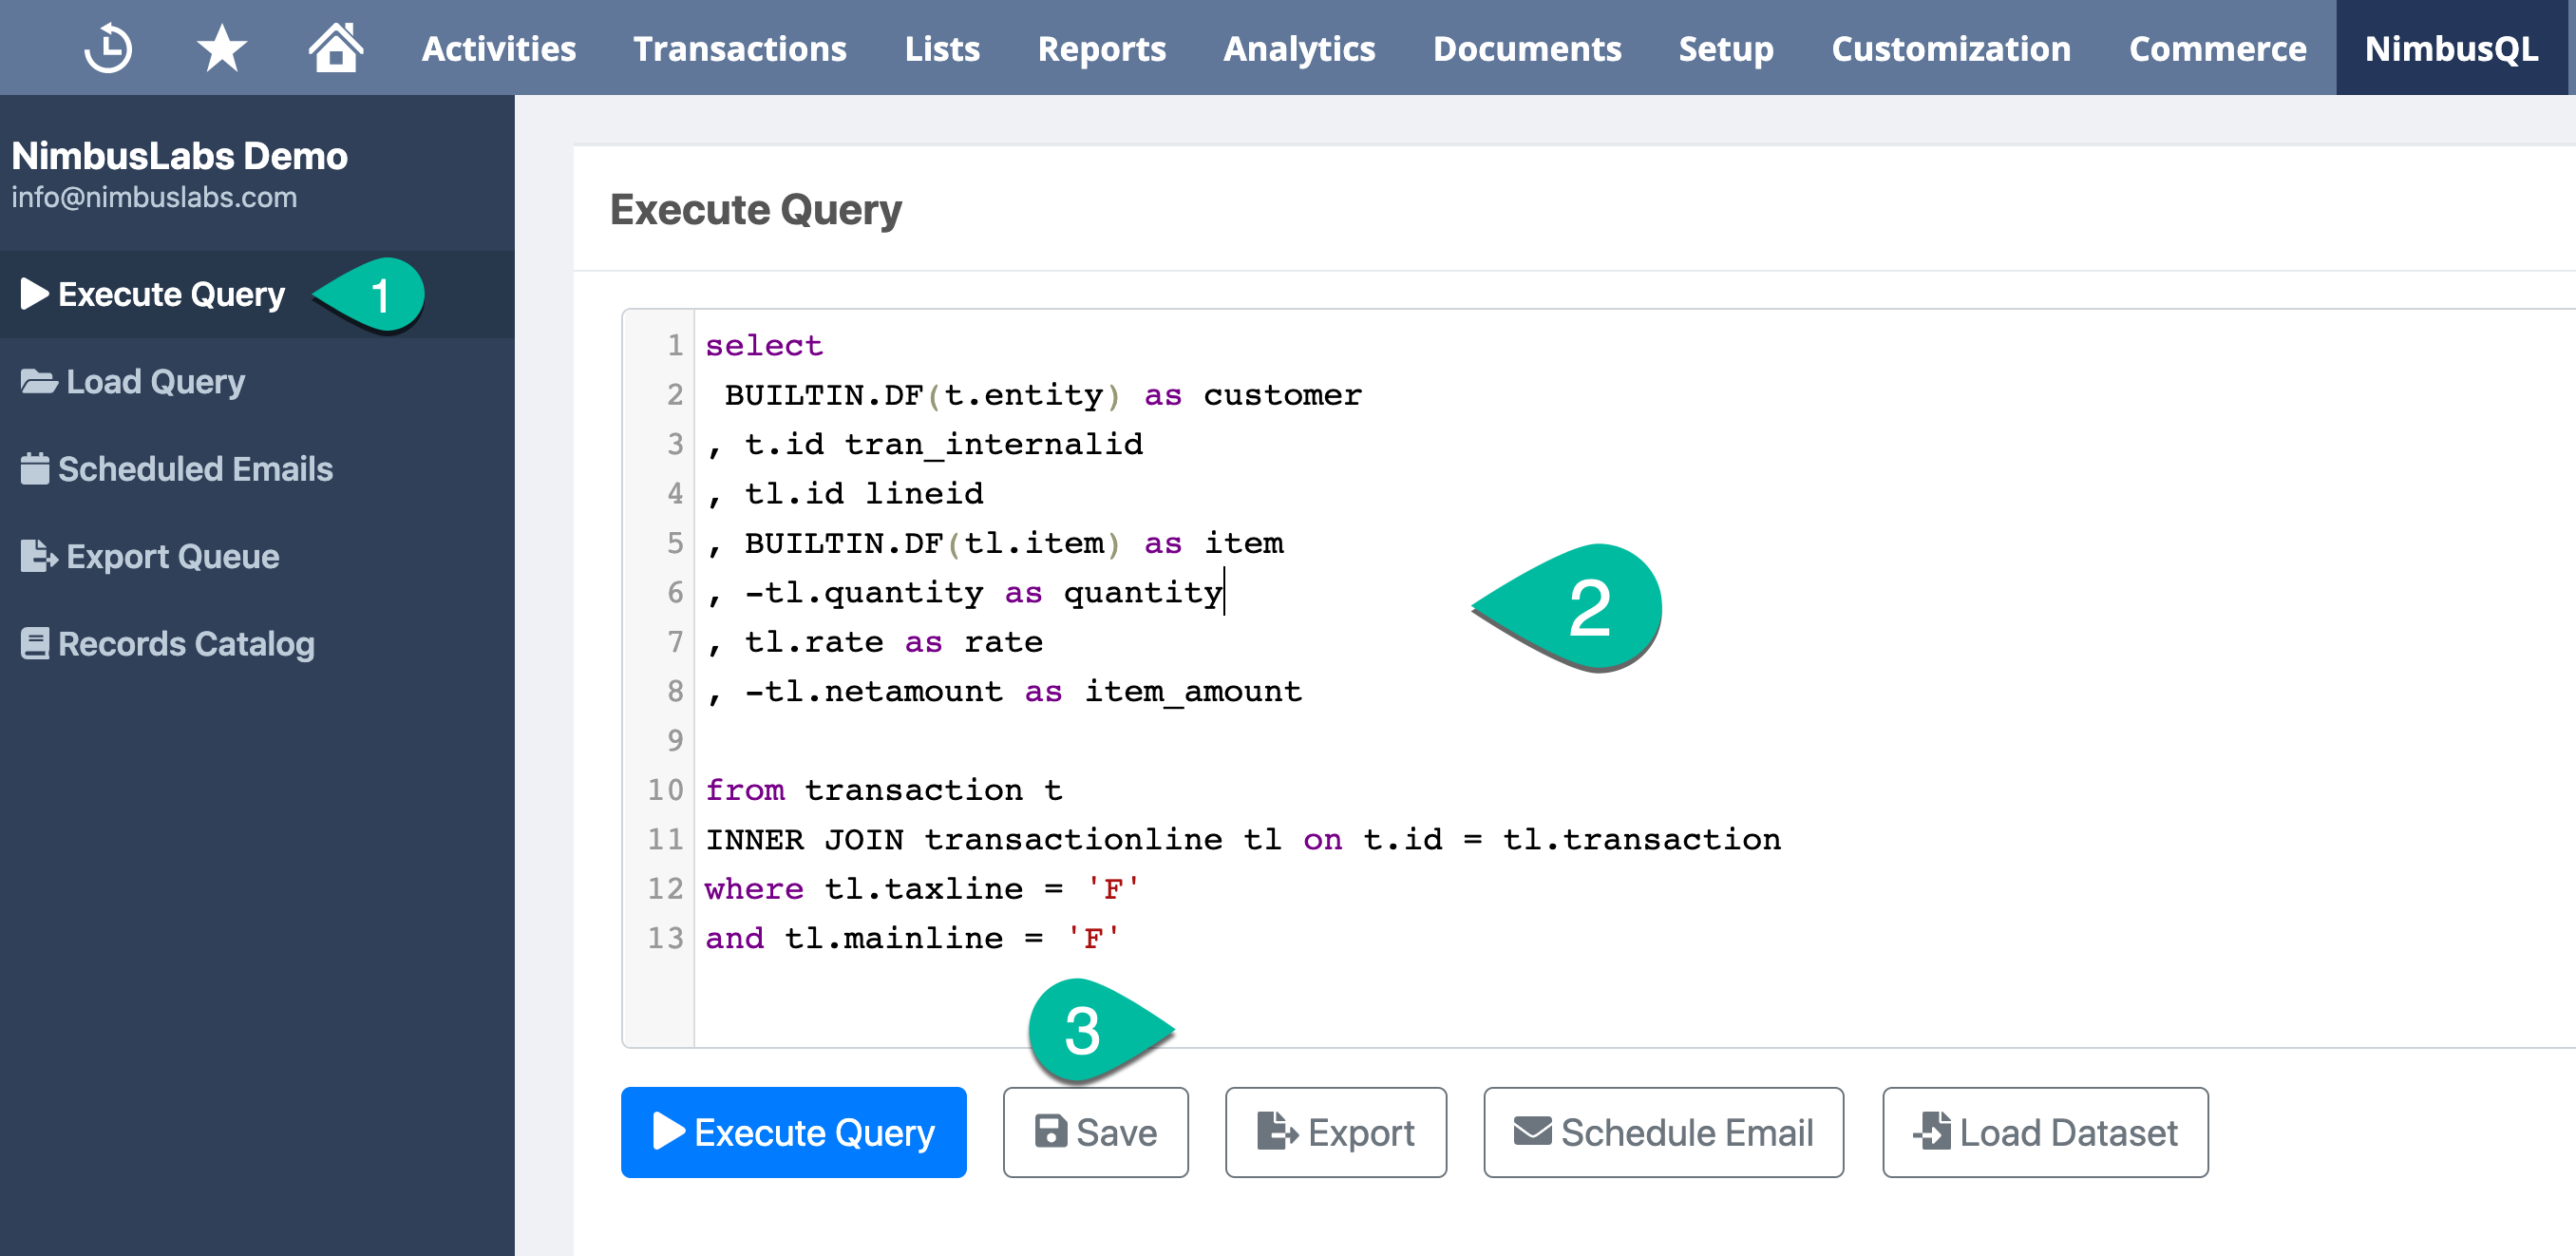
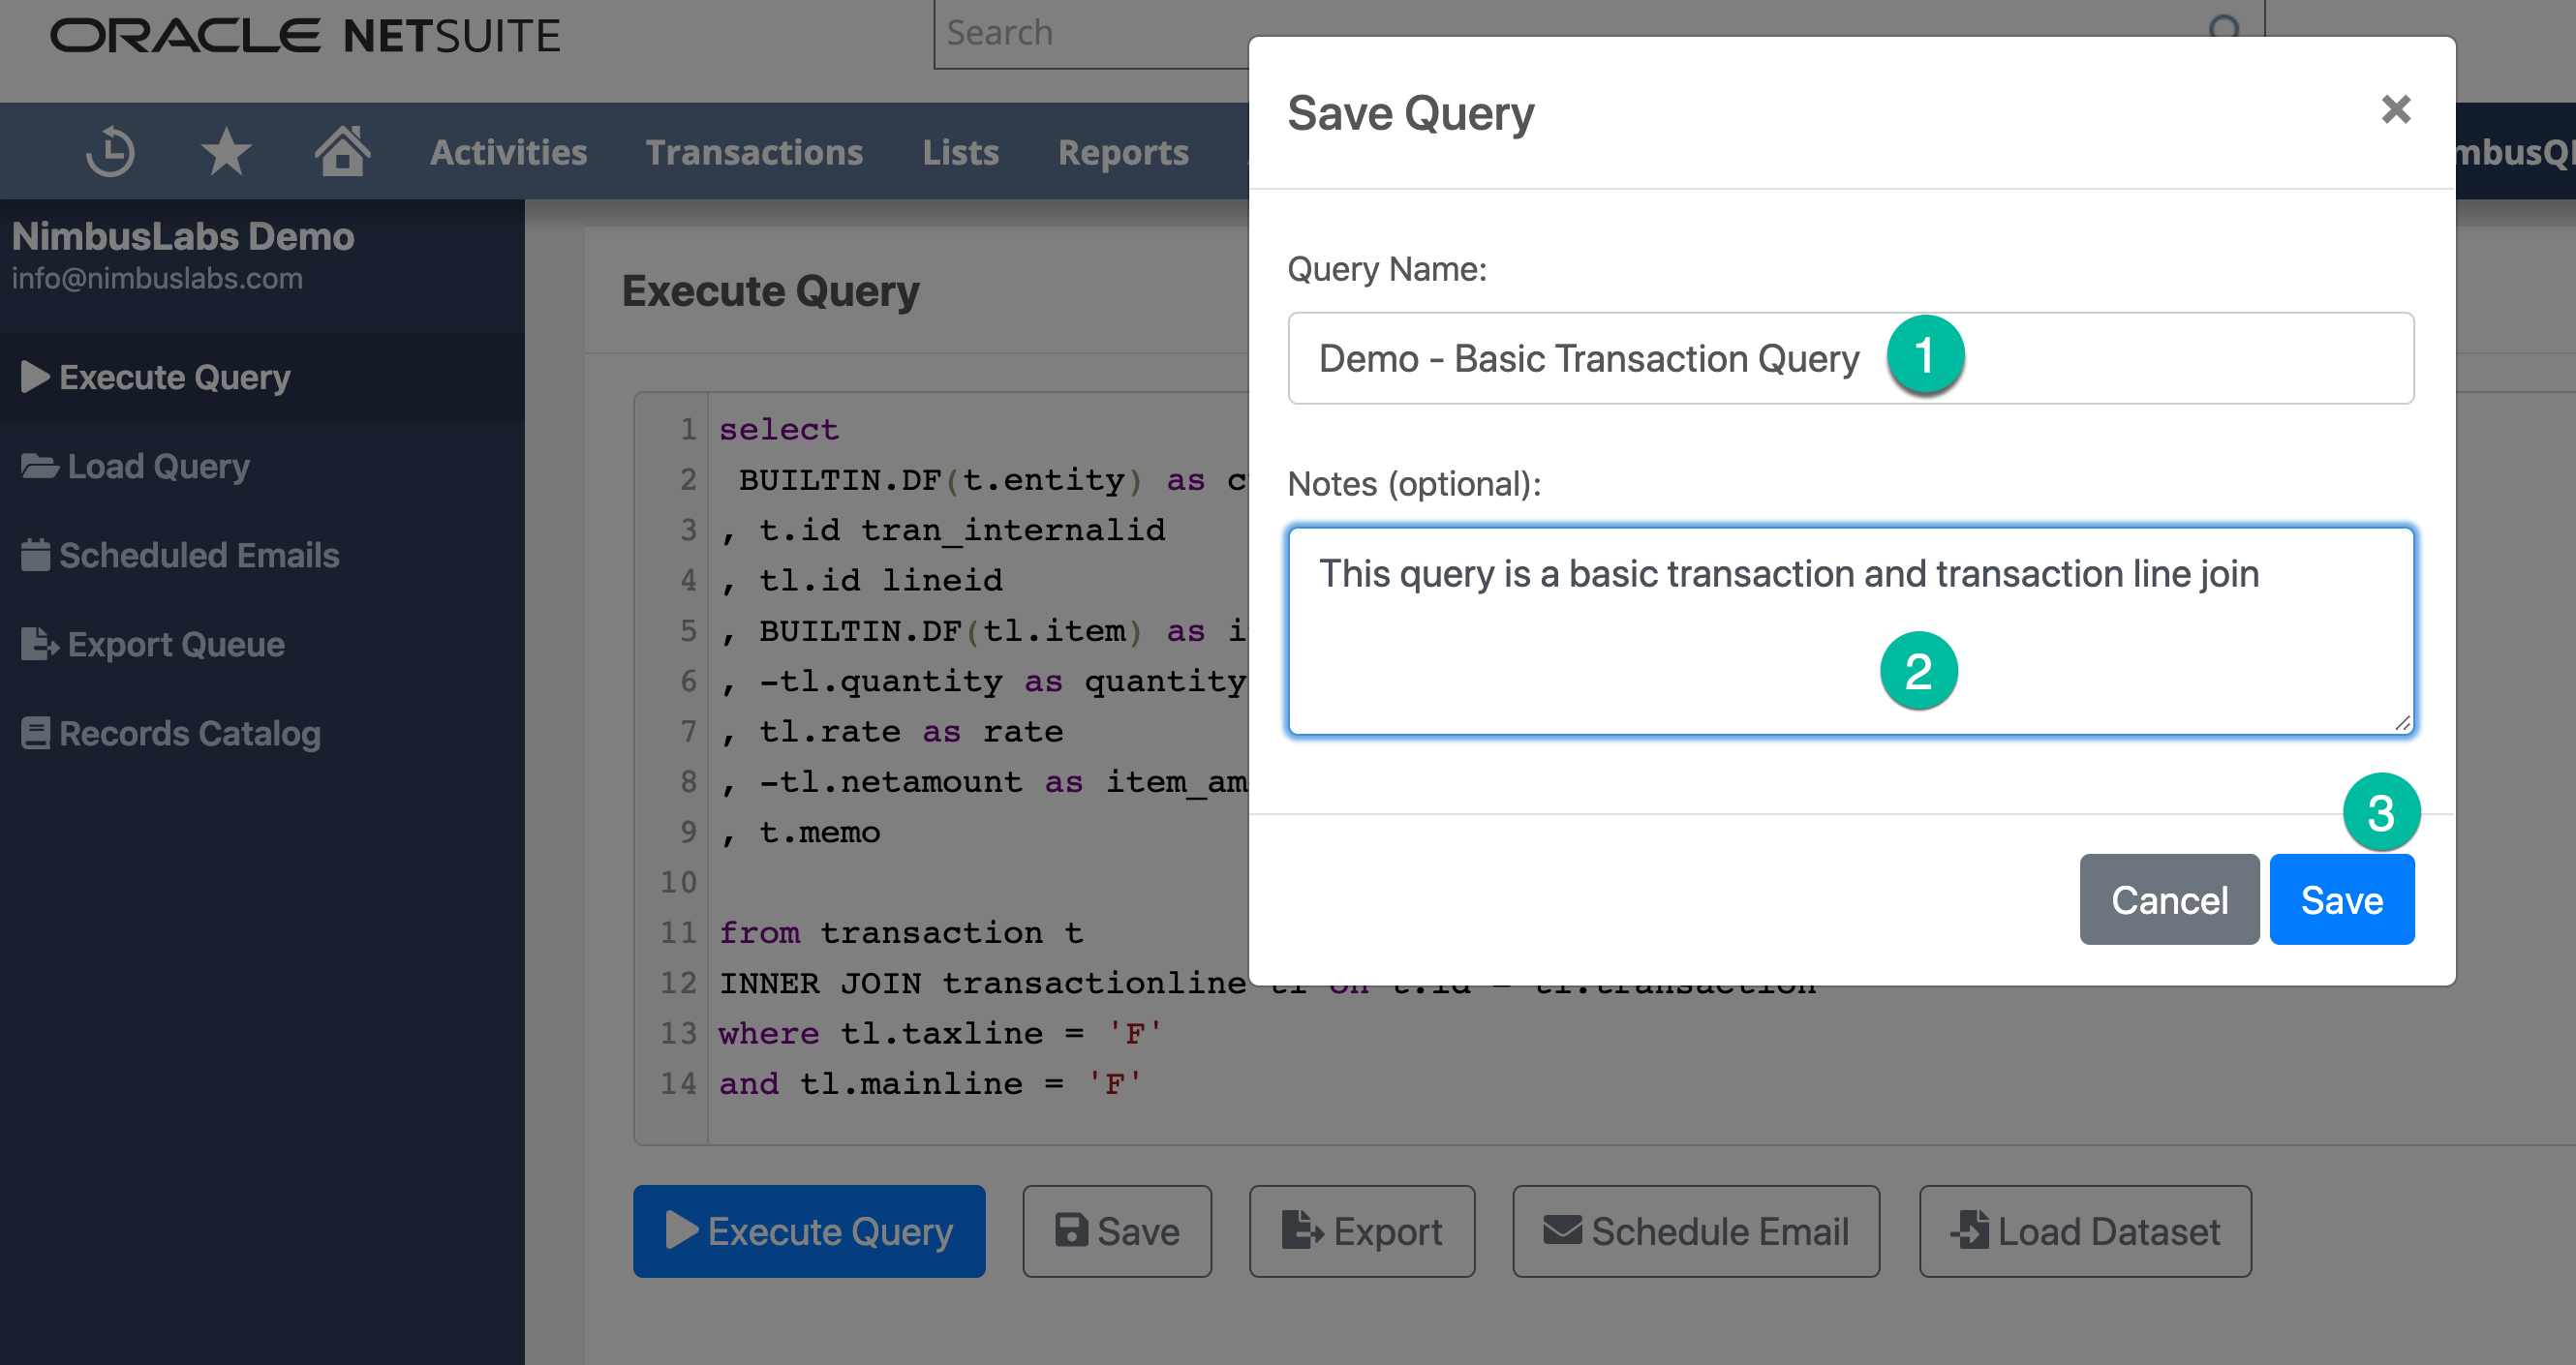
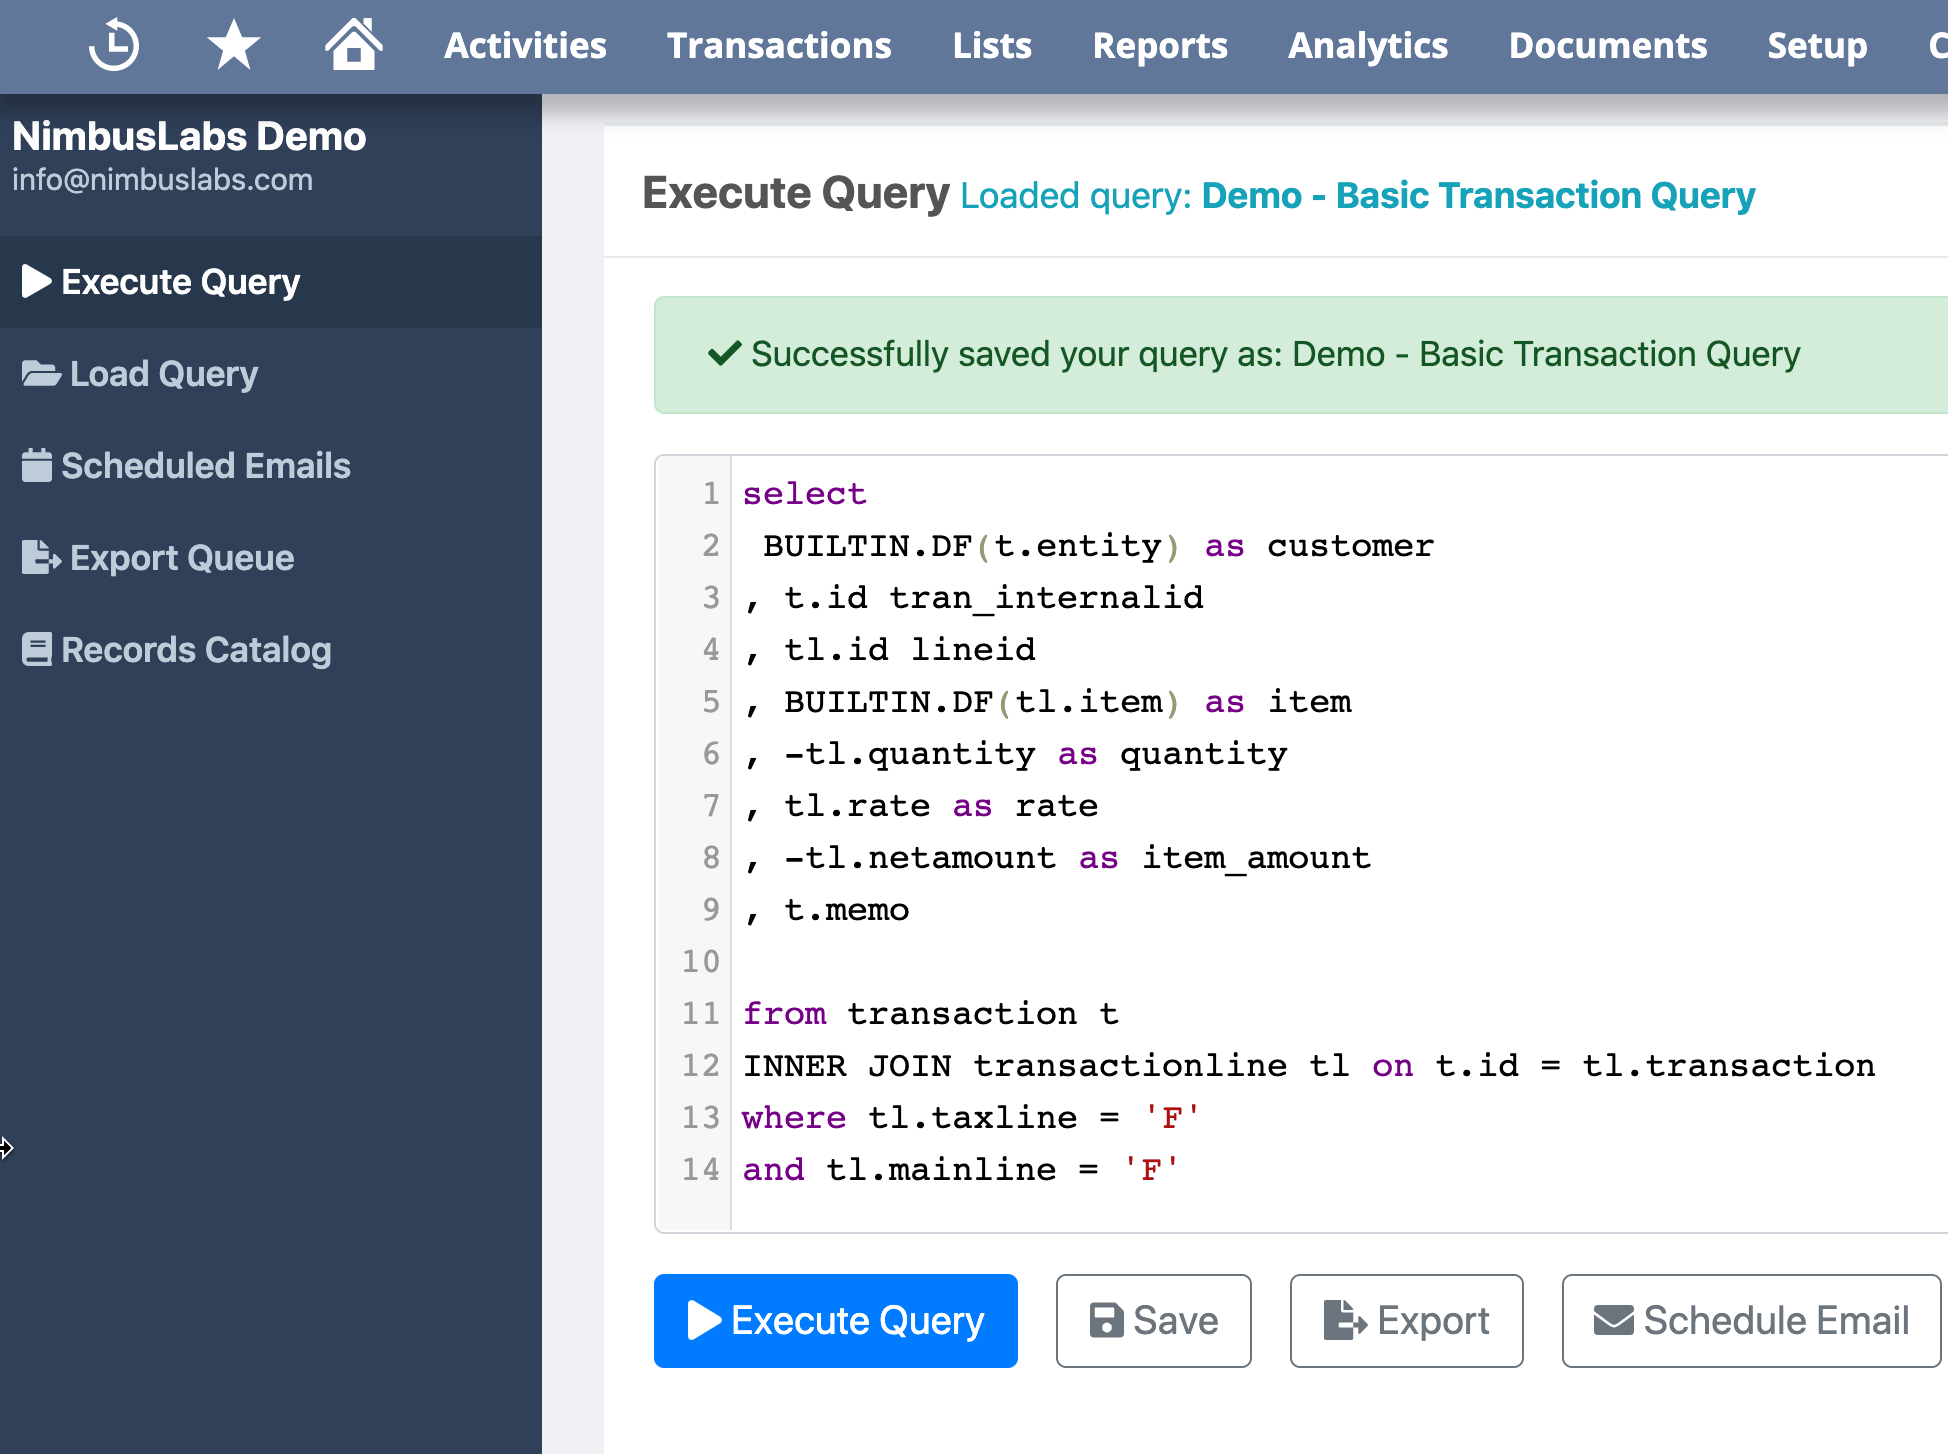
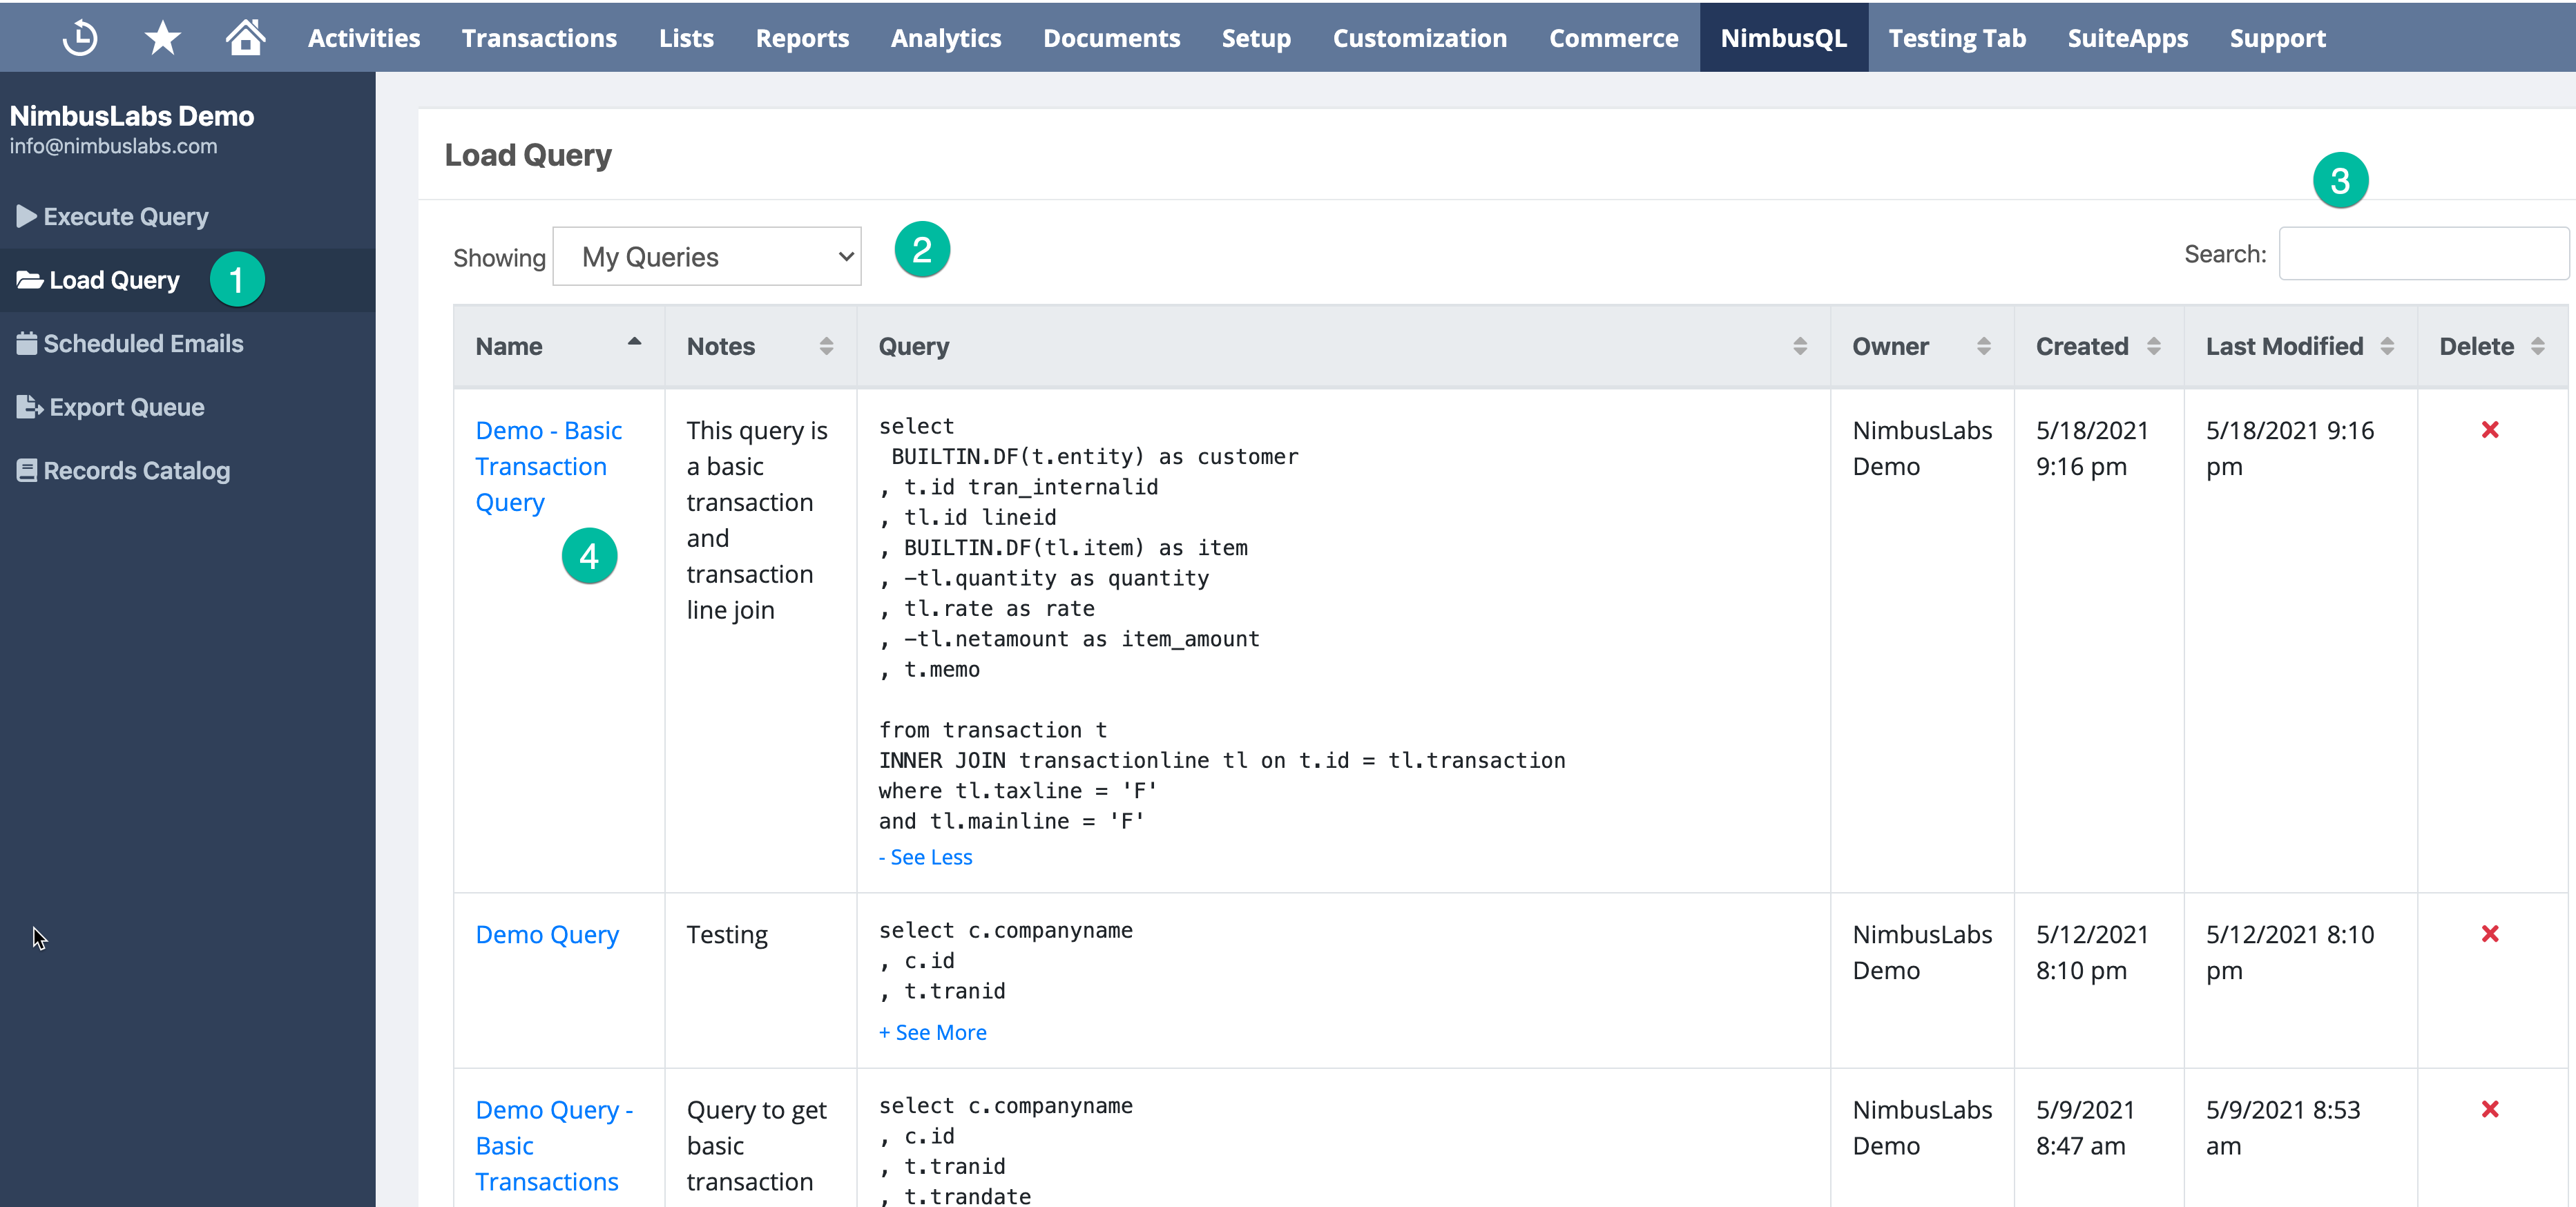
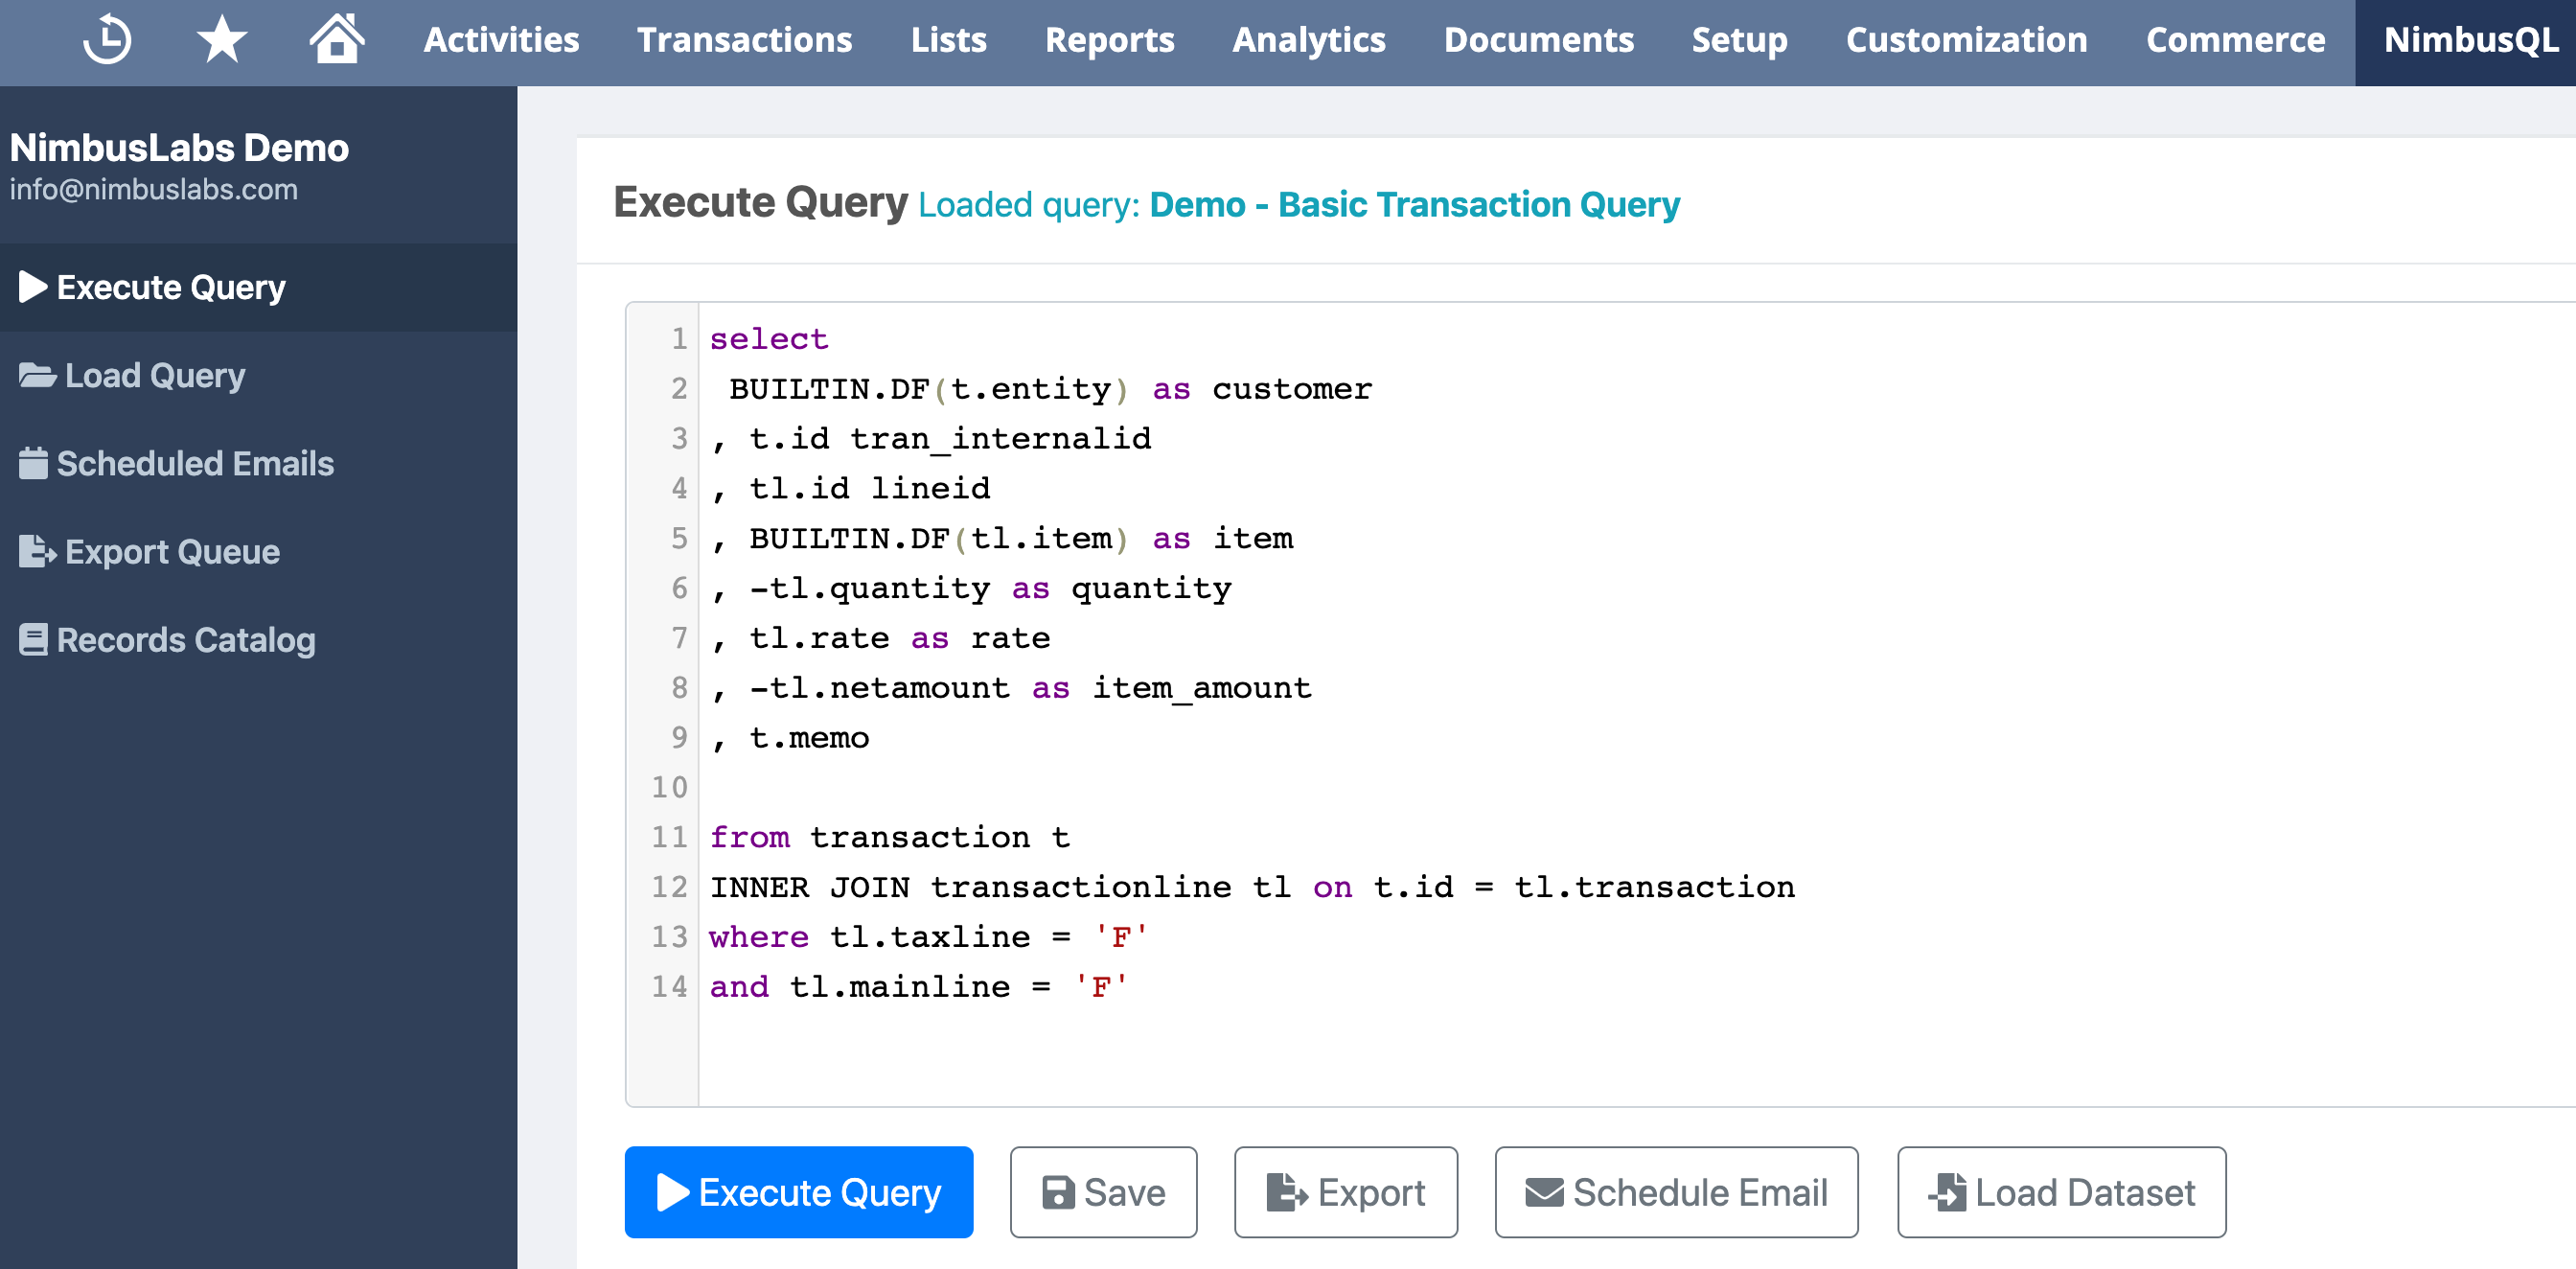
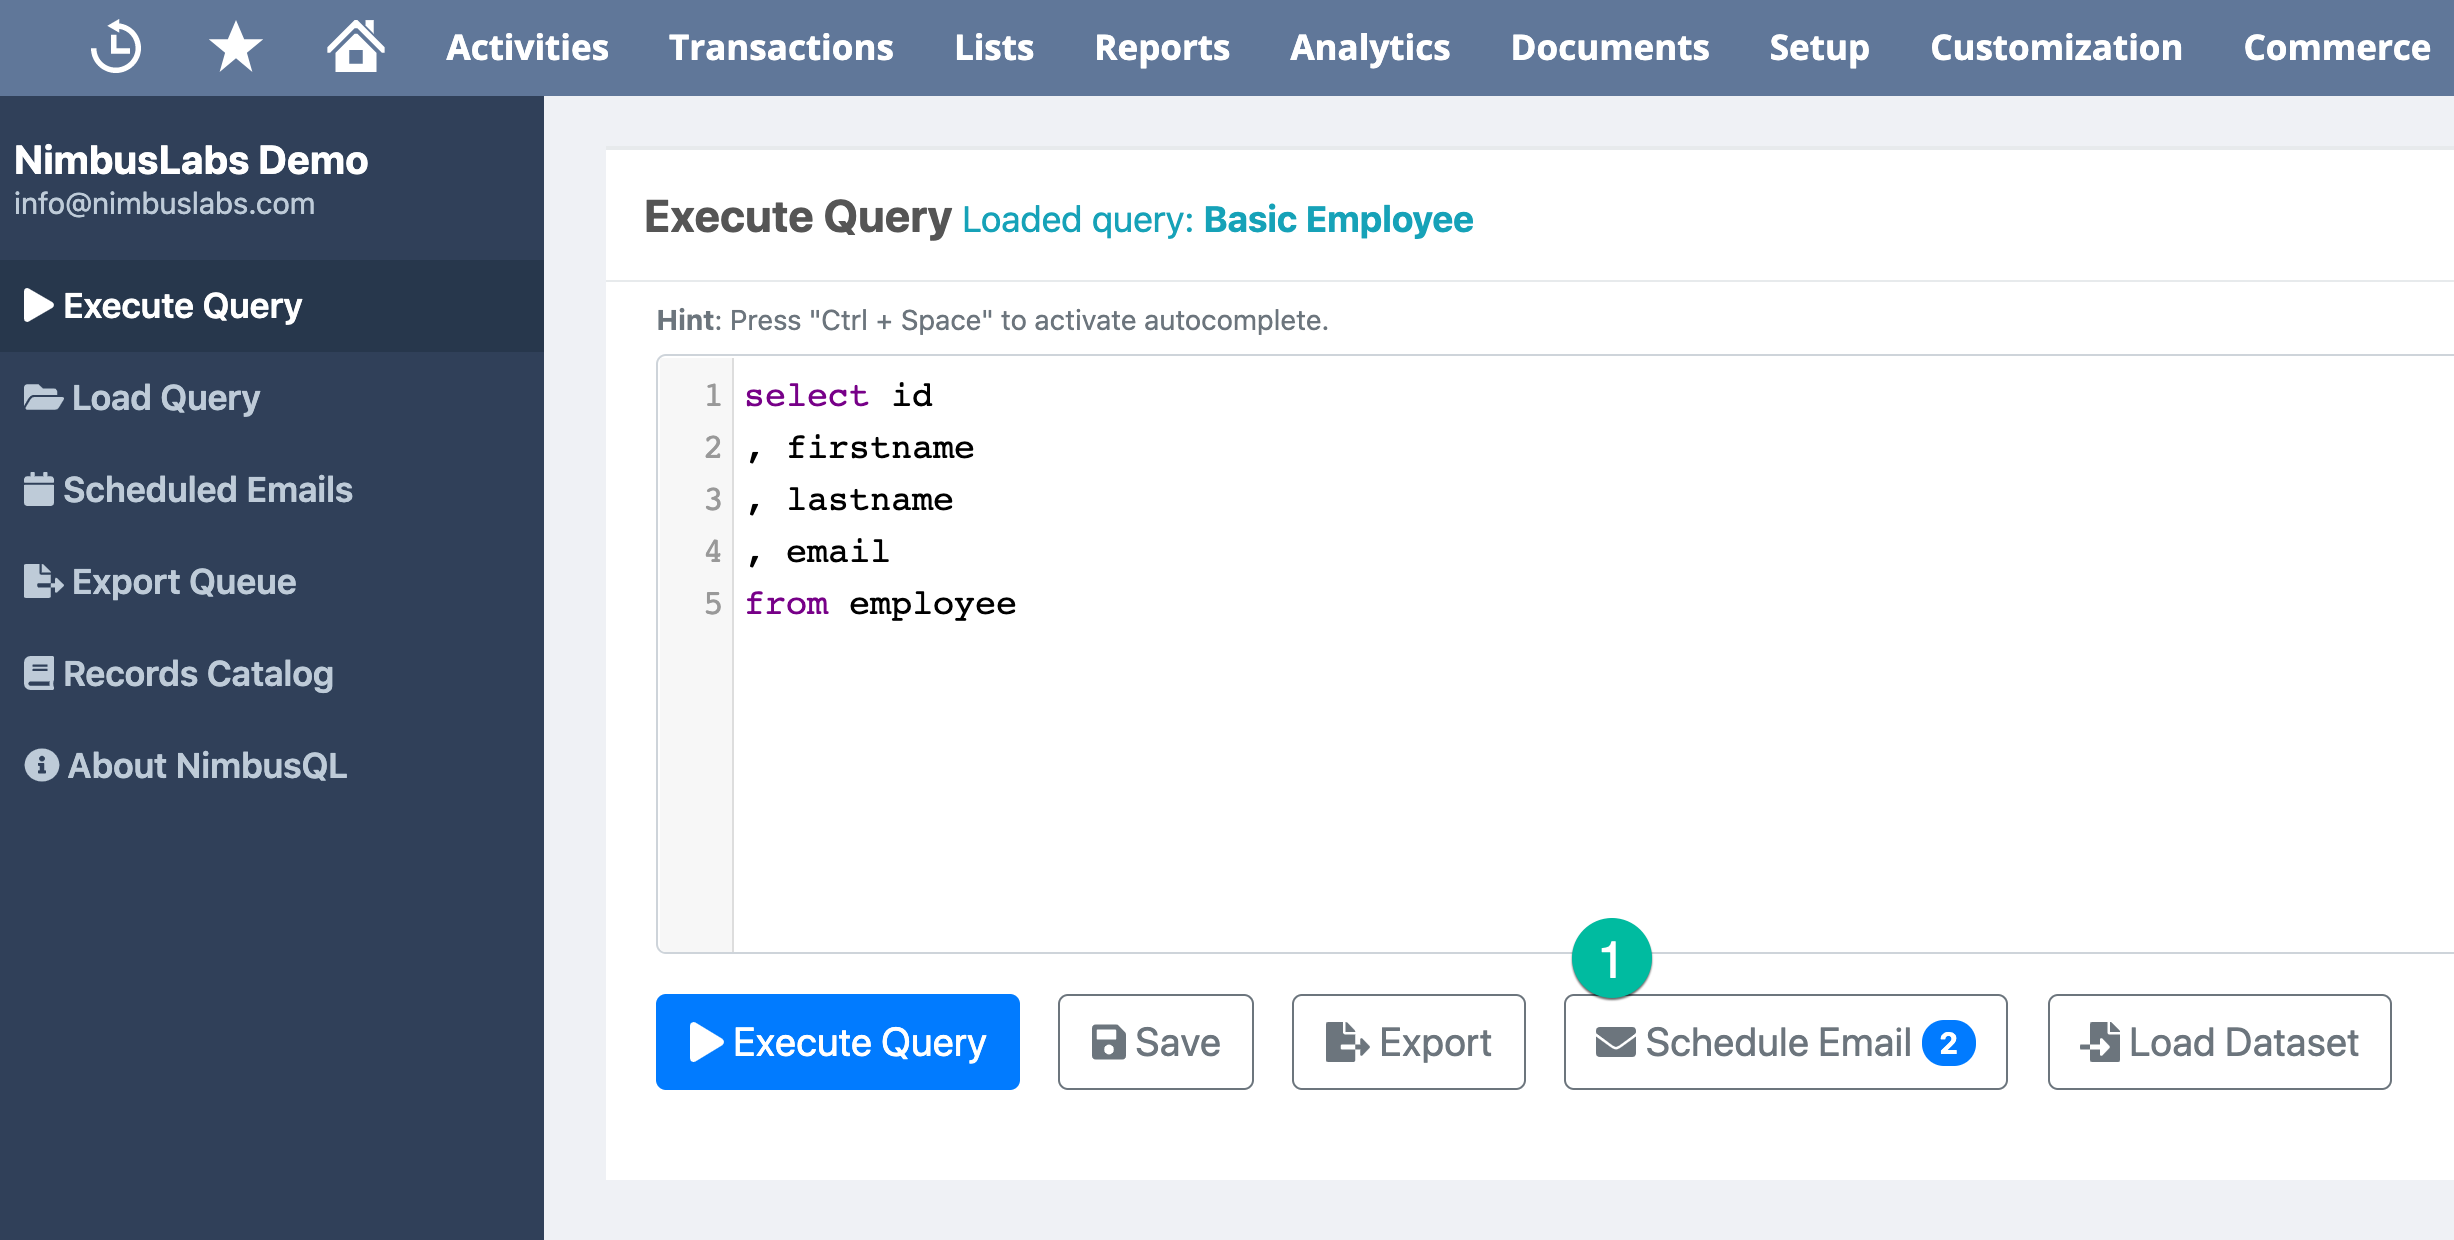
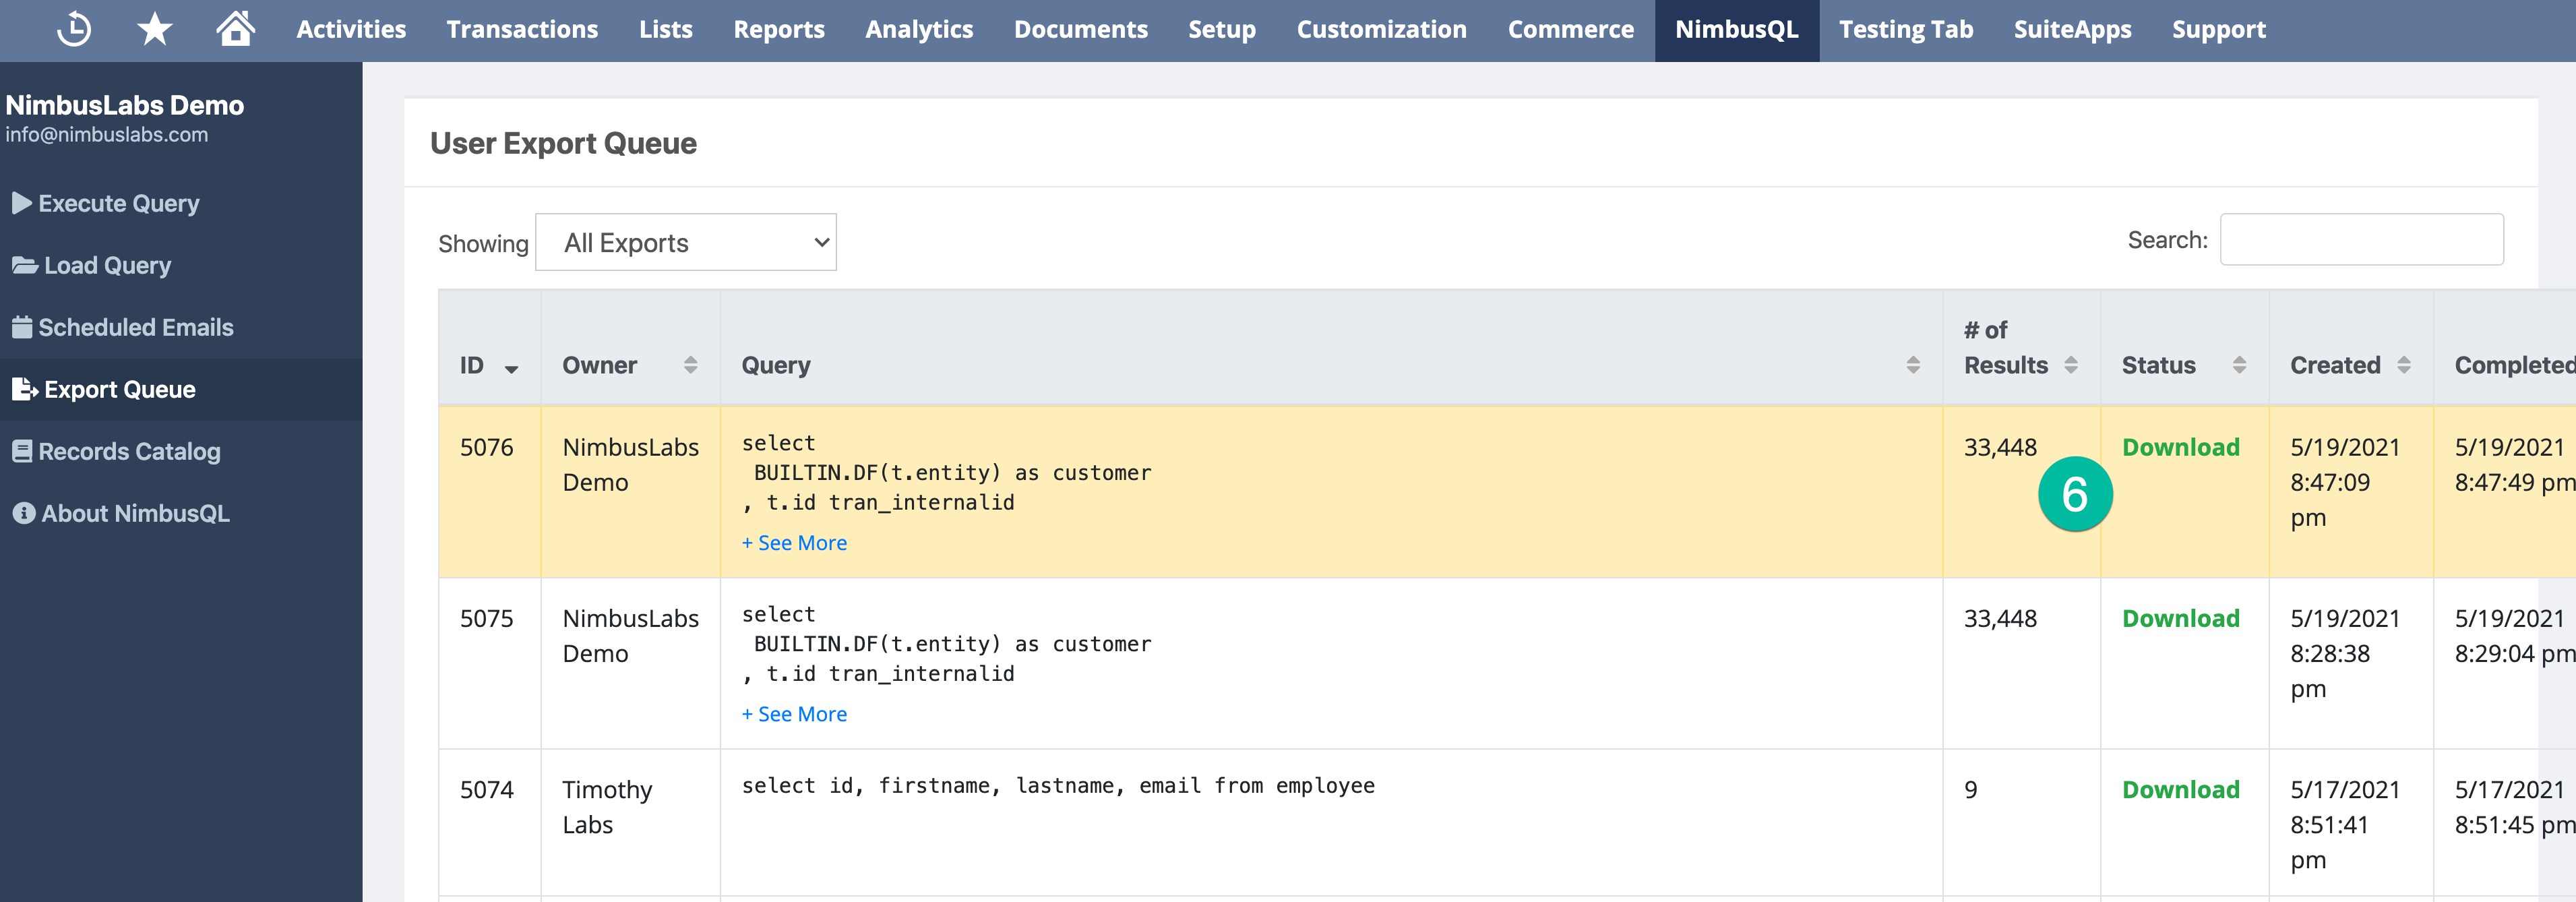
Query Your NetSuite
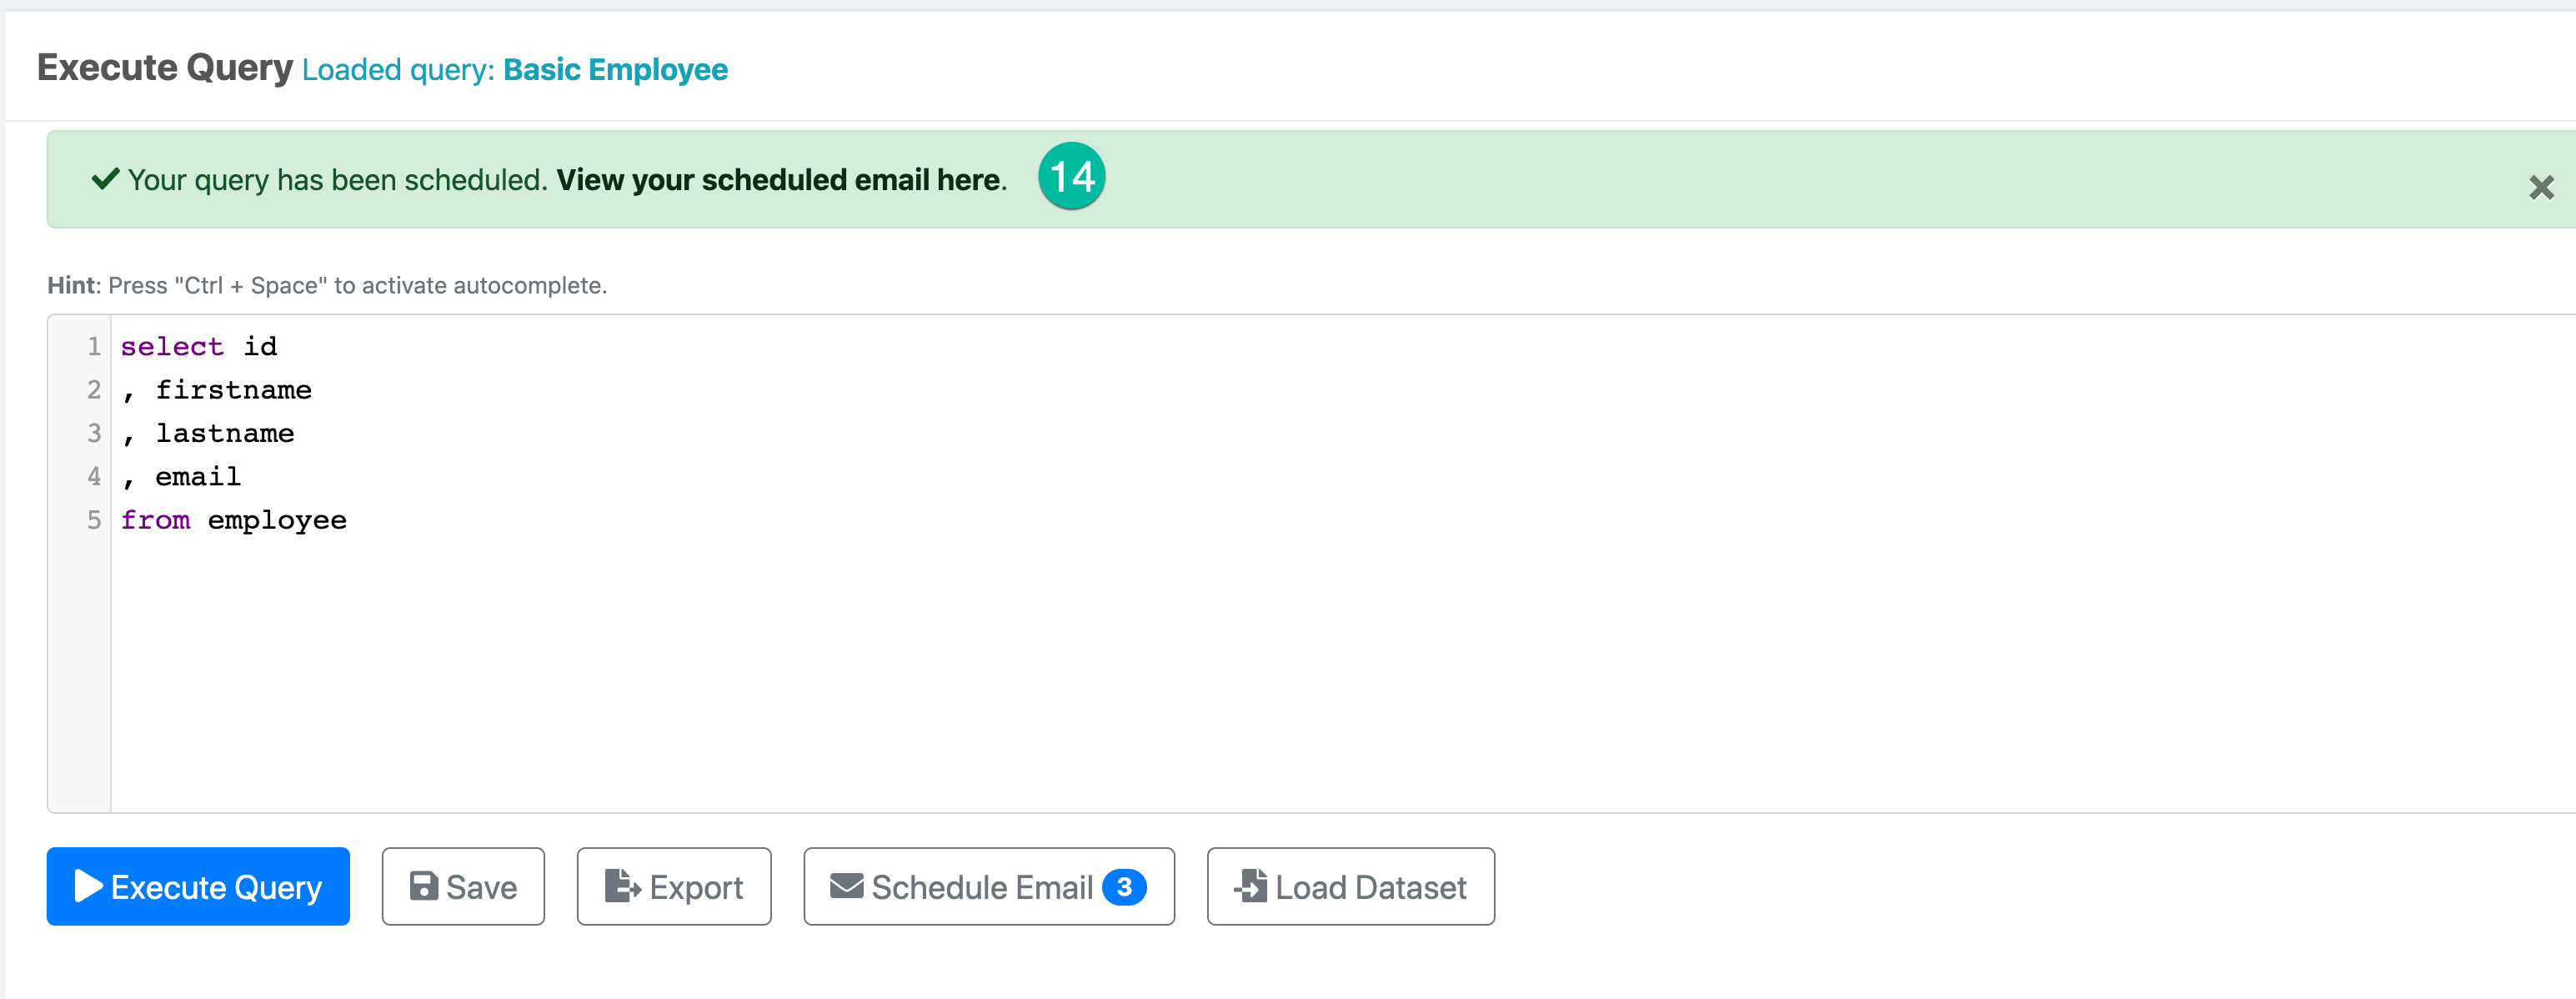
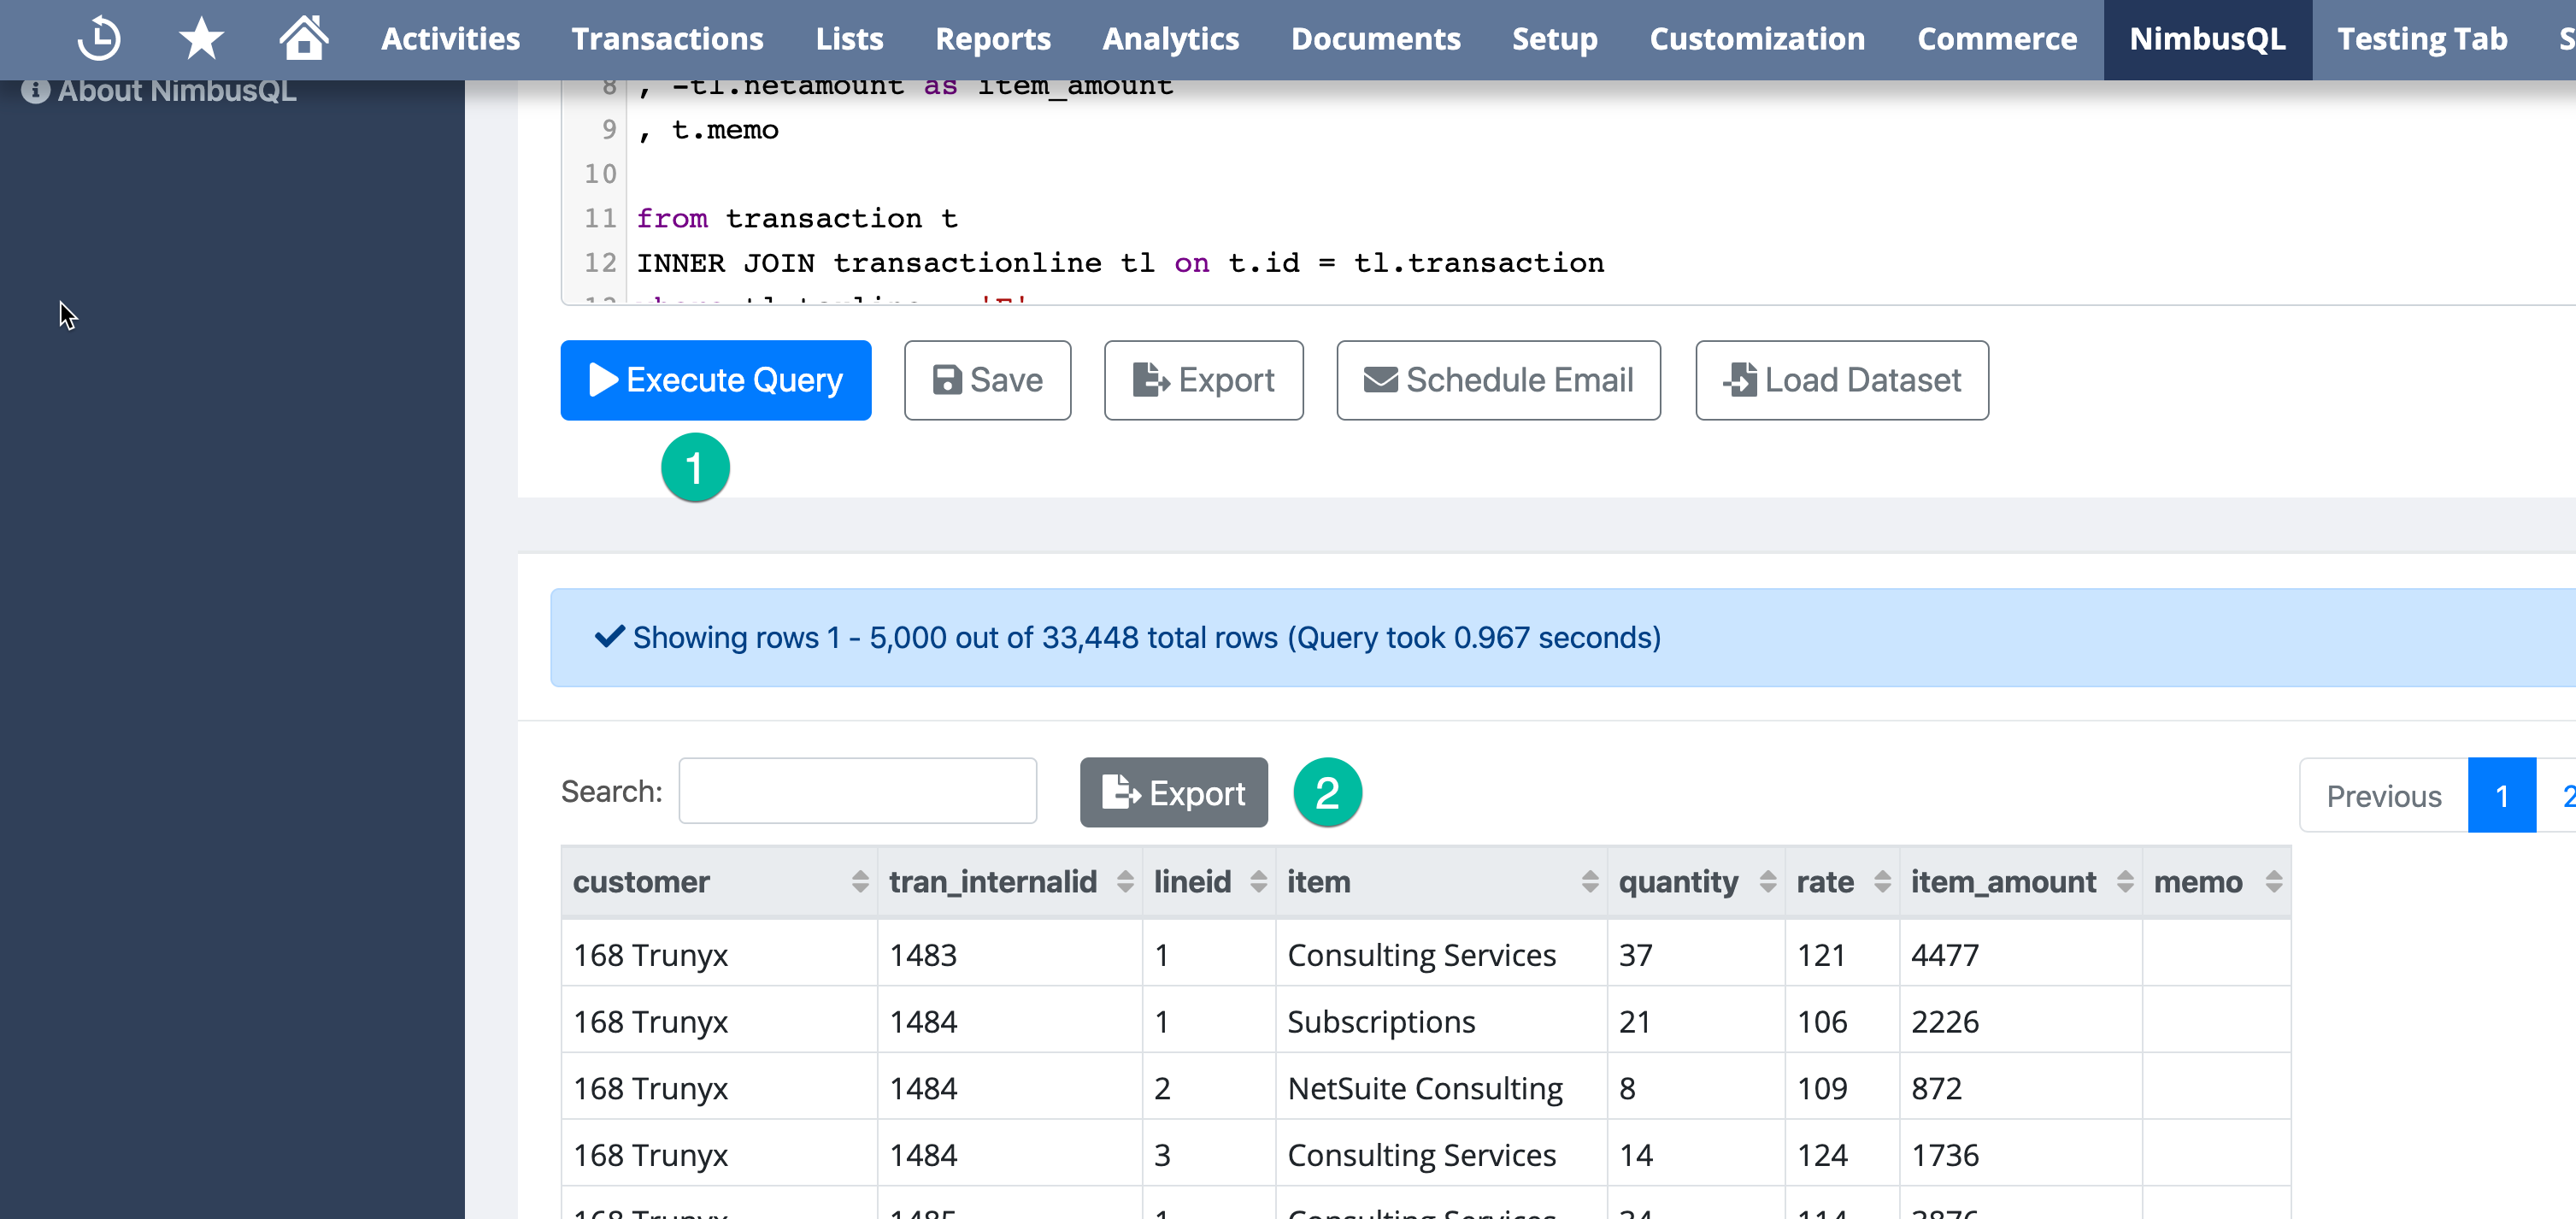
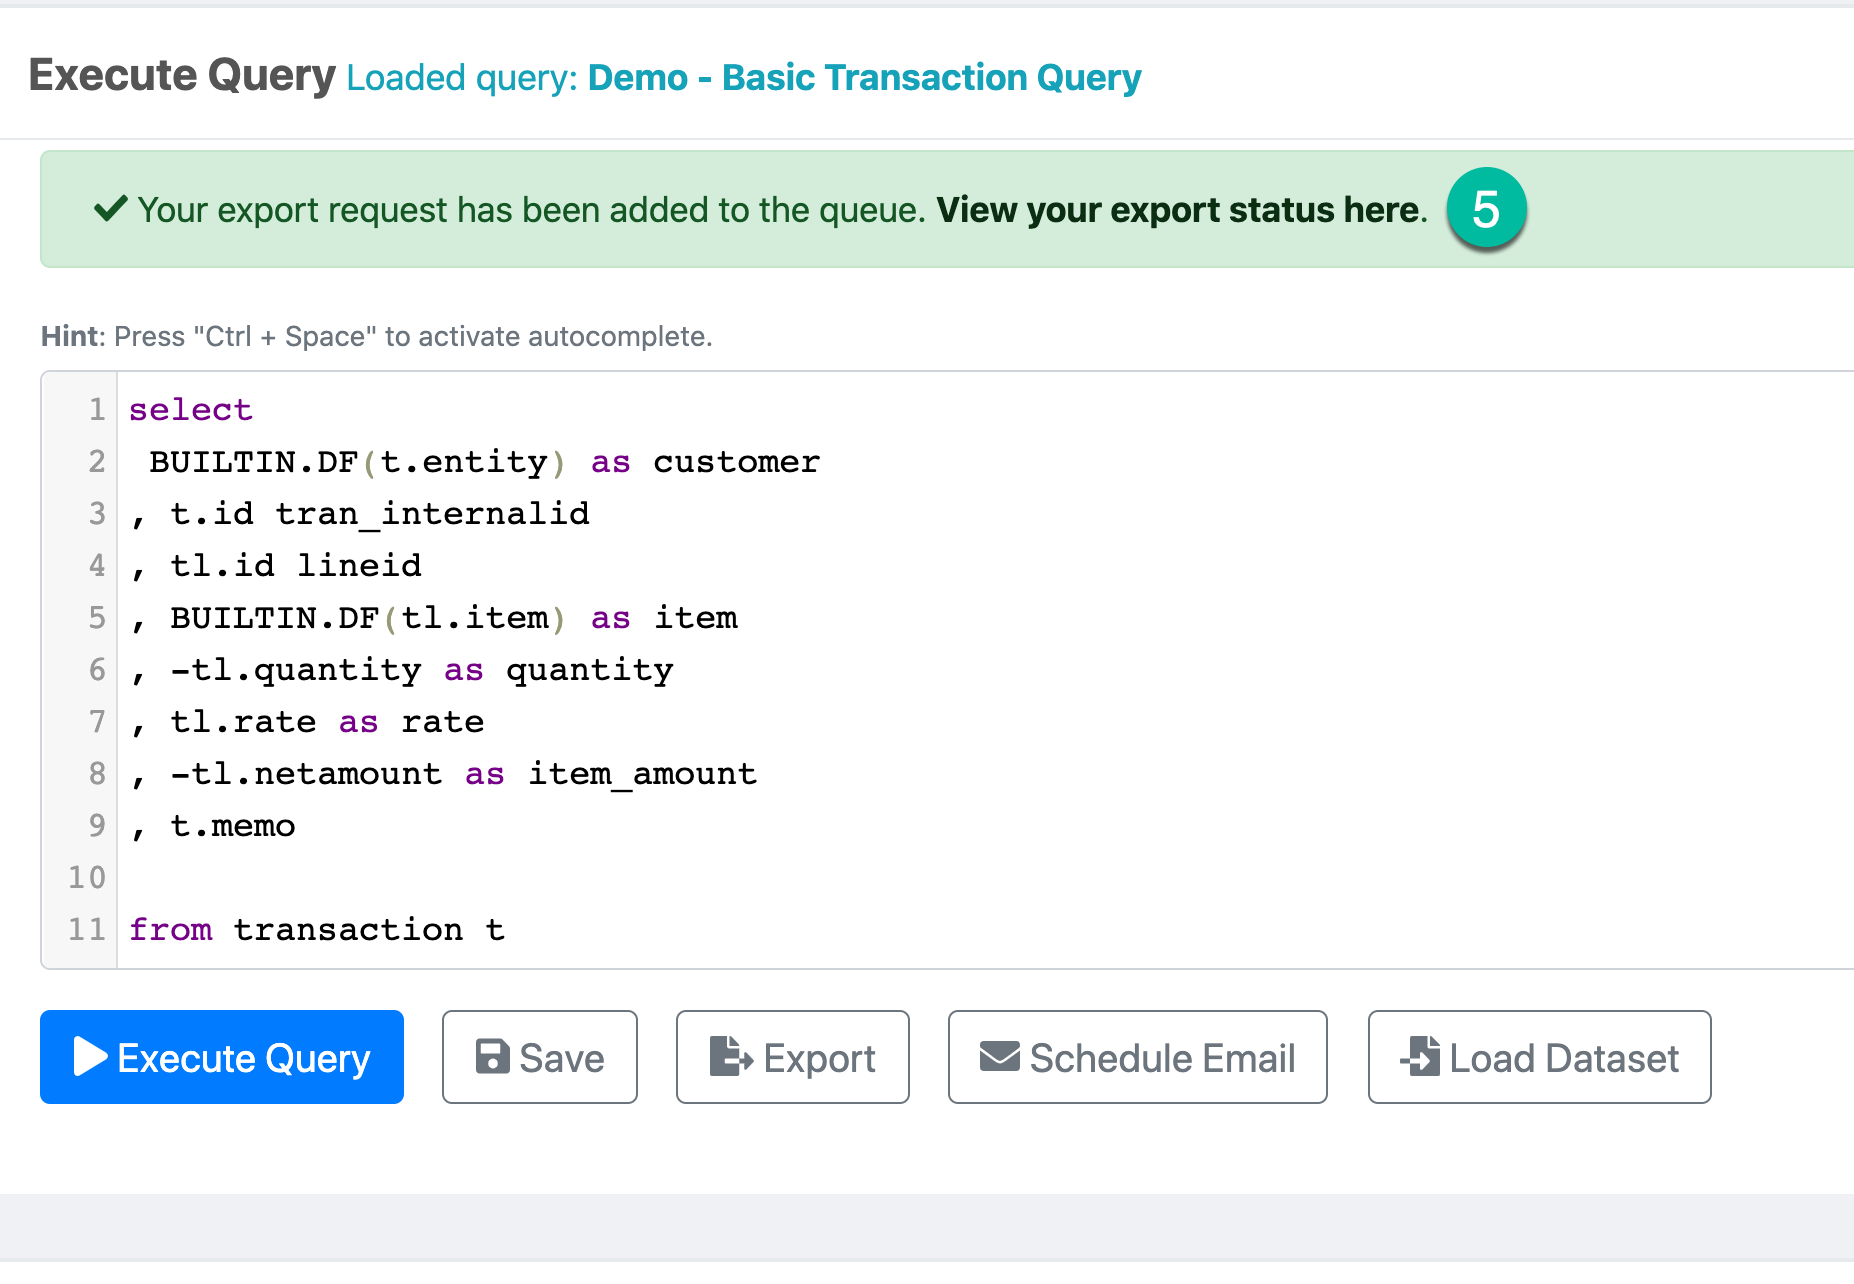
Developing reports for your business or your clients can be tedious and time-consuming, but it doesn’t need to be. We’ve created a ‘Built In NetSuite’ application to help you quickly and efficiently develop SQL queries, including multi-level joins and combining different datasets within the same query—without navigating away from the tool.

With NimbusDash, you can:
With NimbusDash, you can:
Features
Save pre-filtered views on each dashboard to apply sets of filters with a single click. Quickly cycle through these views to evaluate metrics without needing to create multiple dashboards for the same data sets.
For Excel-equivalent pivot tables, use pivot mode to analyze data across grouped columns and rows. Charts can also be created from pivot mode, either ad-hoc or as part of the dashboard.
The grid displays all of the data used for the dashboard. Data is stored in memory which results in lightning-fast data analysis and charting. Column pinning/freezing, filtering, row grouping, multi-column sorting, views, and more make analyzing data simple and efficient.