Getting Started with NimbusDash in NetSuite
Follow these steps to set up and configure dashboards in NimbusDash using NetSuite:
Step 1: Navigate to NimbusDash
- Locate NimbusDash on the main NetSuite menu bar.
- Click to access the New Dashboard page.

Step 2: Choose a Data Source
- Select a data source from the type-ahead list.
- You can choose any Saved Search or NimbusQL query you have access to.
- Once selected, click Next.

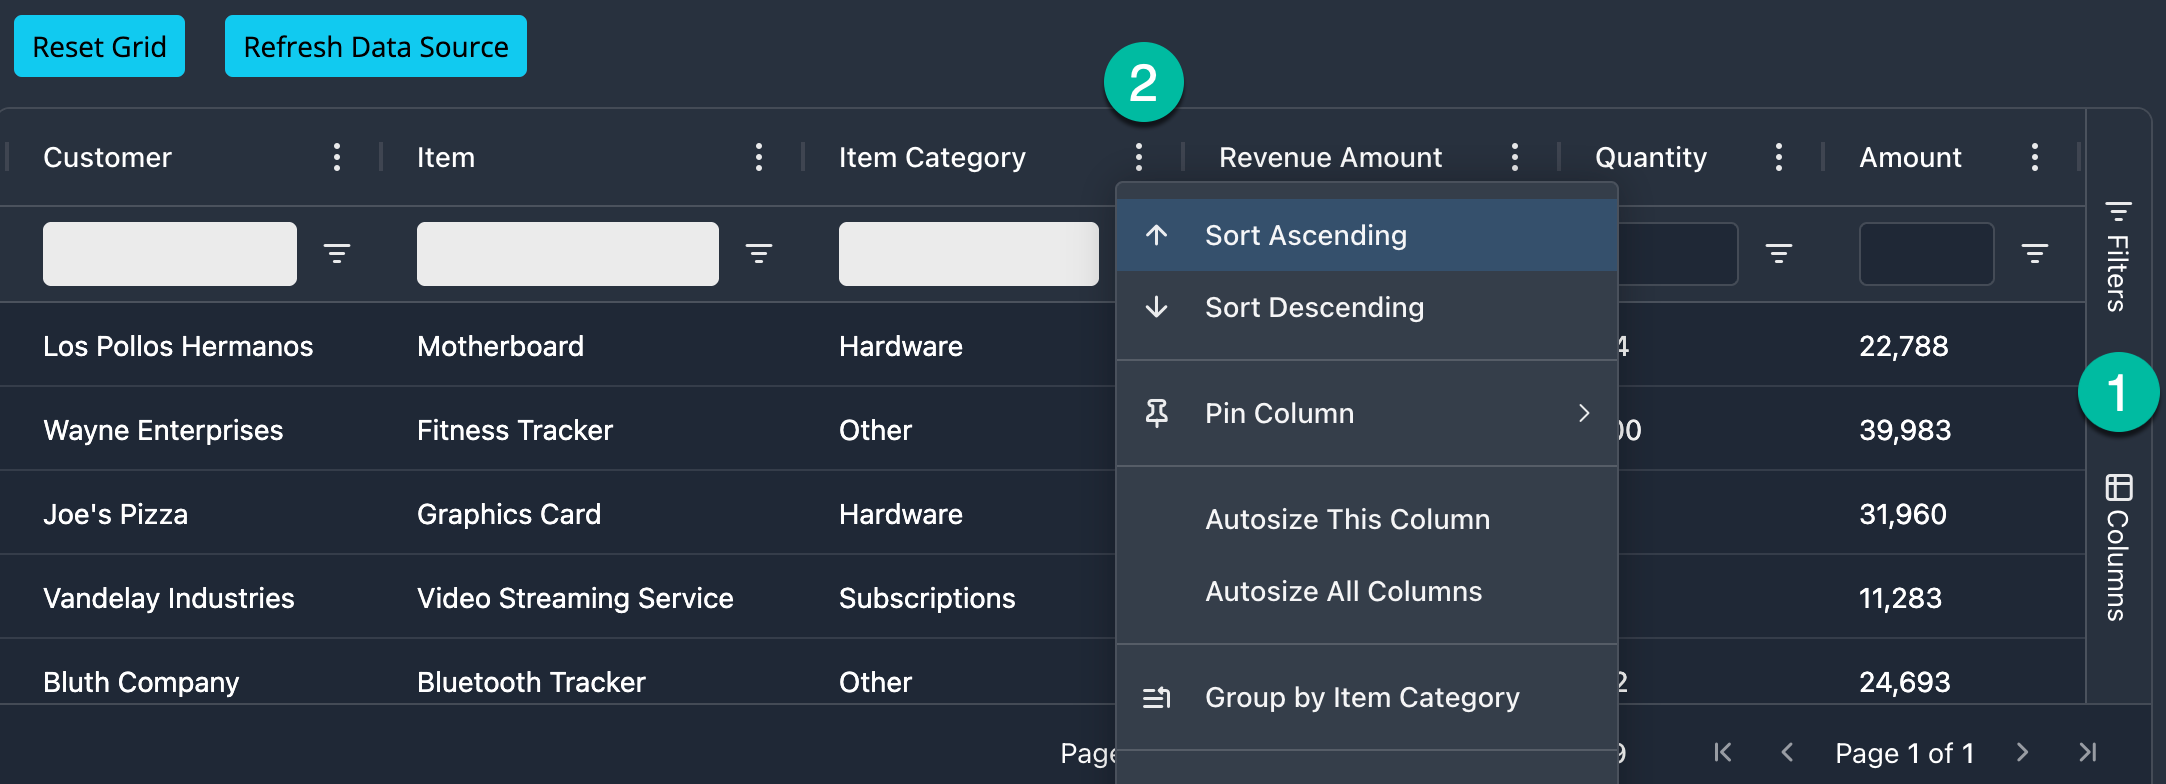
Step 3: View and Configure the Grid
- The grid will populate with the results of your selected data source.
- On the right-hand side of the grid, you’ll find two tabs:
- Filters Tab: For applying filters to your data.
- Columns Tab: To customize displayed columns.
- Use the 3-dots icon on each column for additional options, including:
- Pinning
- Grouping
- Sorting
- Auto-sizing

Step 4: Add a Chart to the Dashboard
- Click the Add Chart button to insert a chart portlet into your dashboard.
- Configure the chart by clicking the 3-dots icon in the top-right corner of the chart portlet and selecting Edit Chart.
Step 5: Configure Your Chart
- Select a Chart Type
- Navigate to the Chart Tab and choose from 24 chart types available.
- Set Categories and Series
- Go to the Set Up Tab to define your Categories and Series.
- The chart will refresh automatically as you make selections.
- Optional Customization
- Use the Customize Tab to configure additional options, such as:
- Legends
- Titles
- Axis labels
- Other styling options
- Use the Customize Tab to configure additional options, such as:


