Easy-to-Build Dashboards
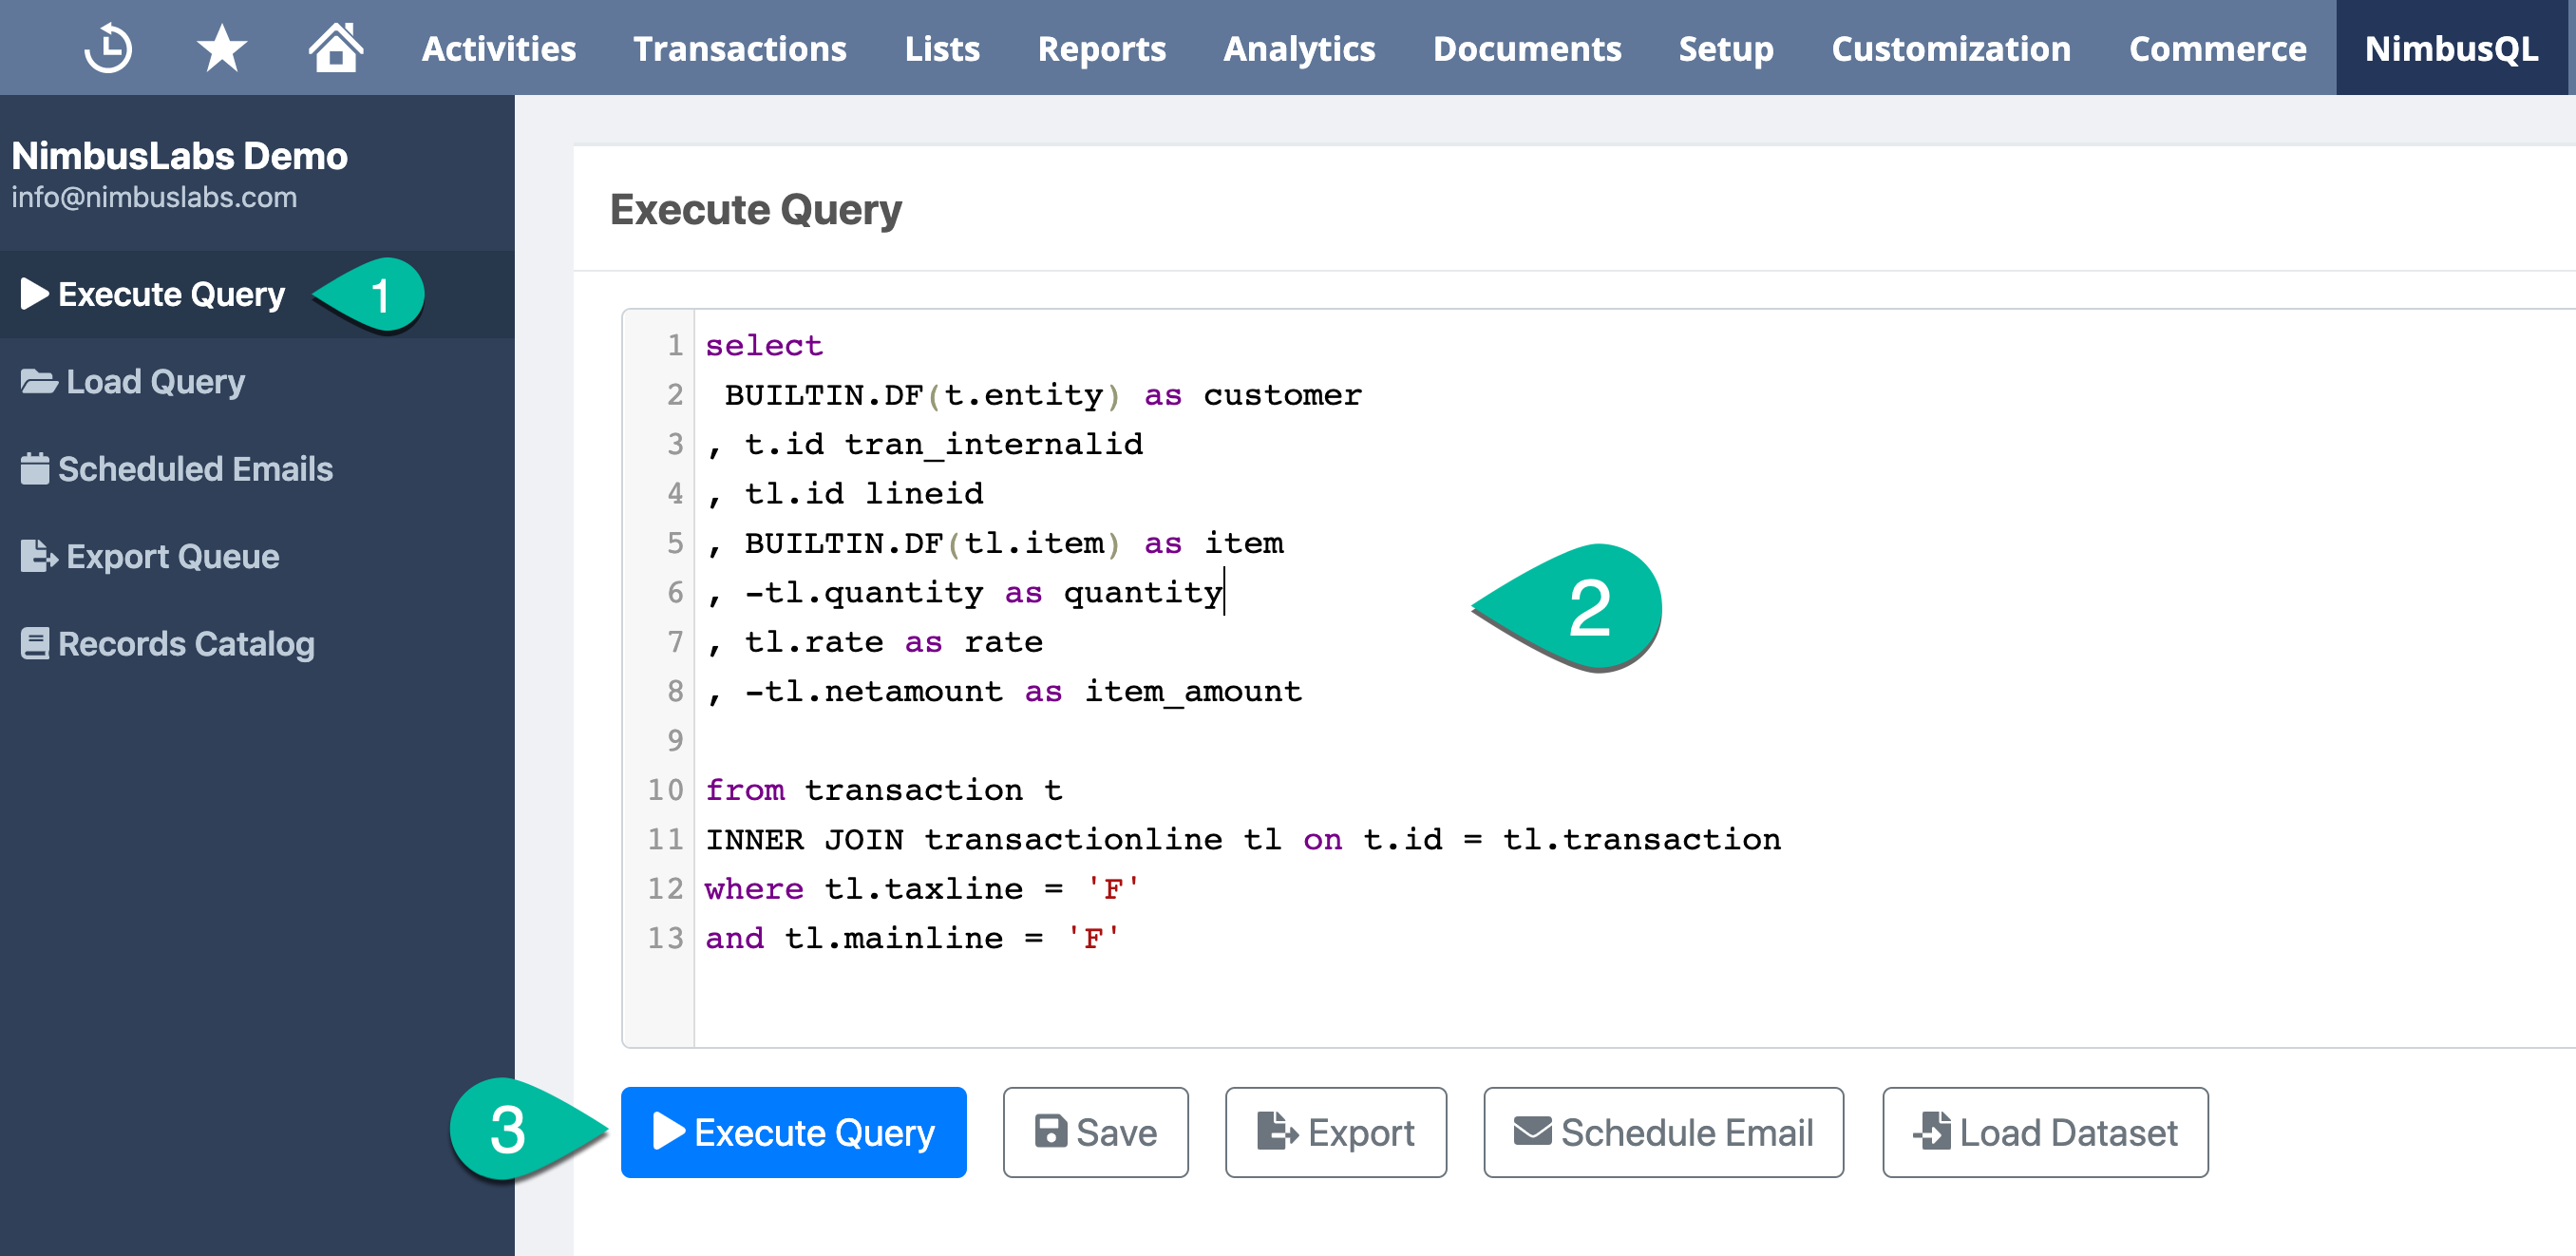
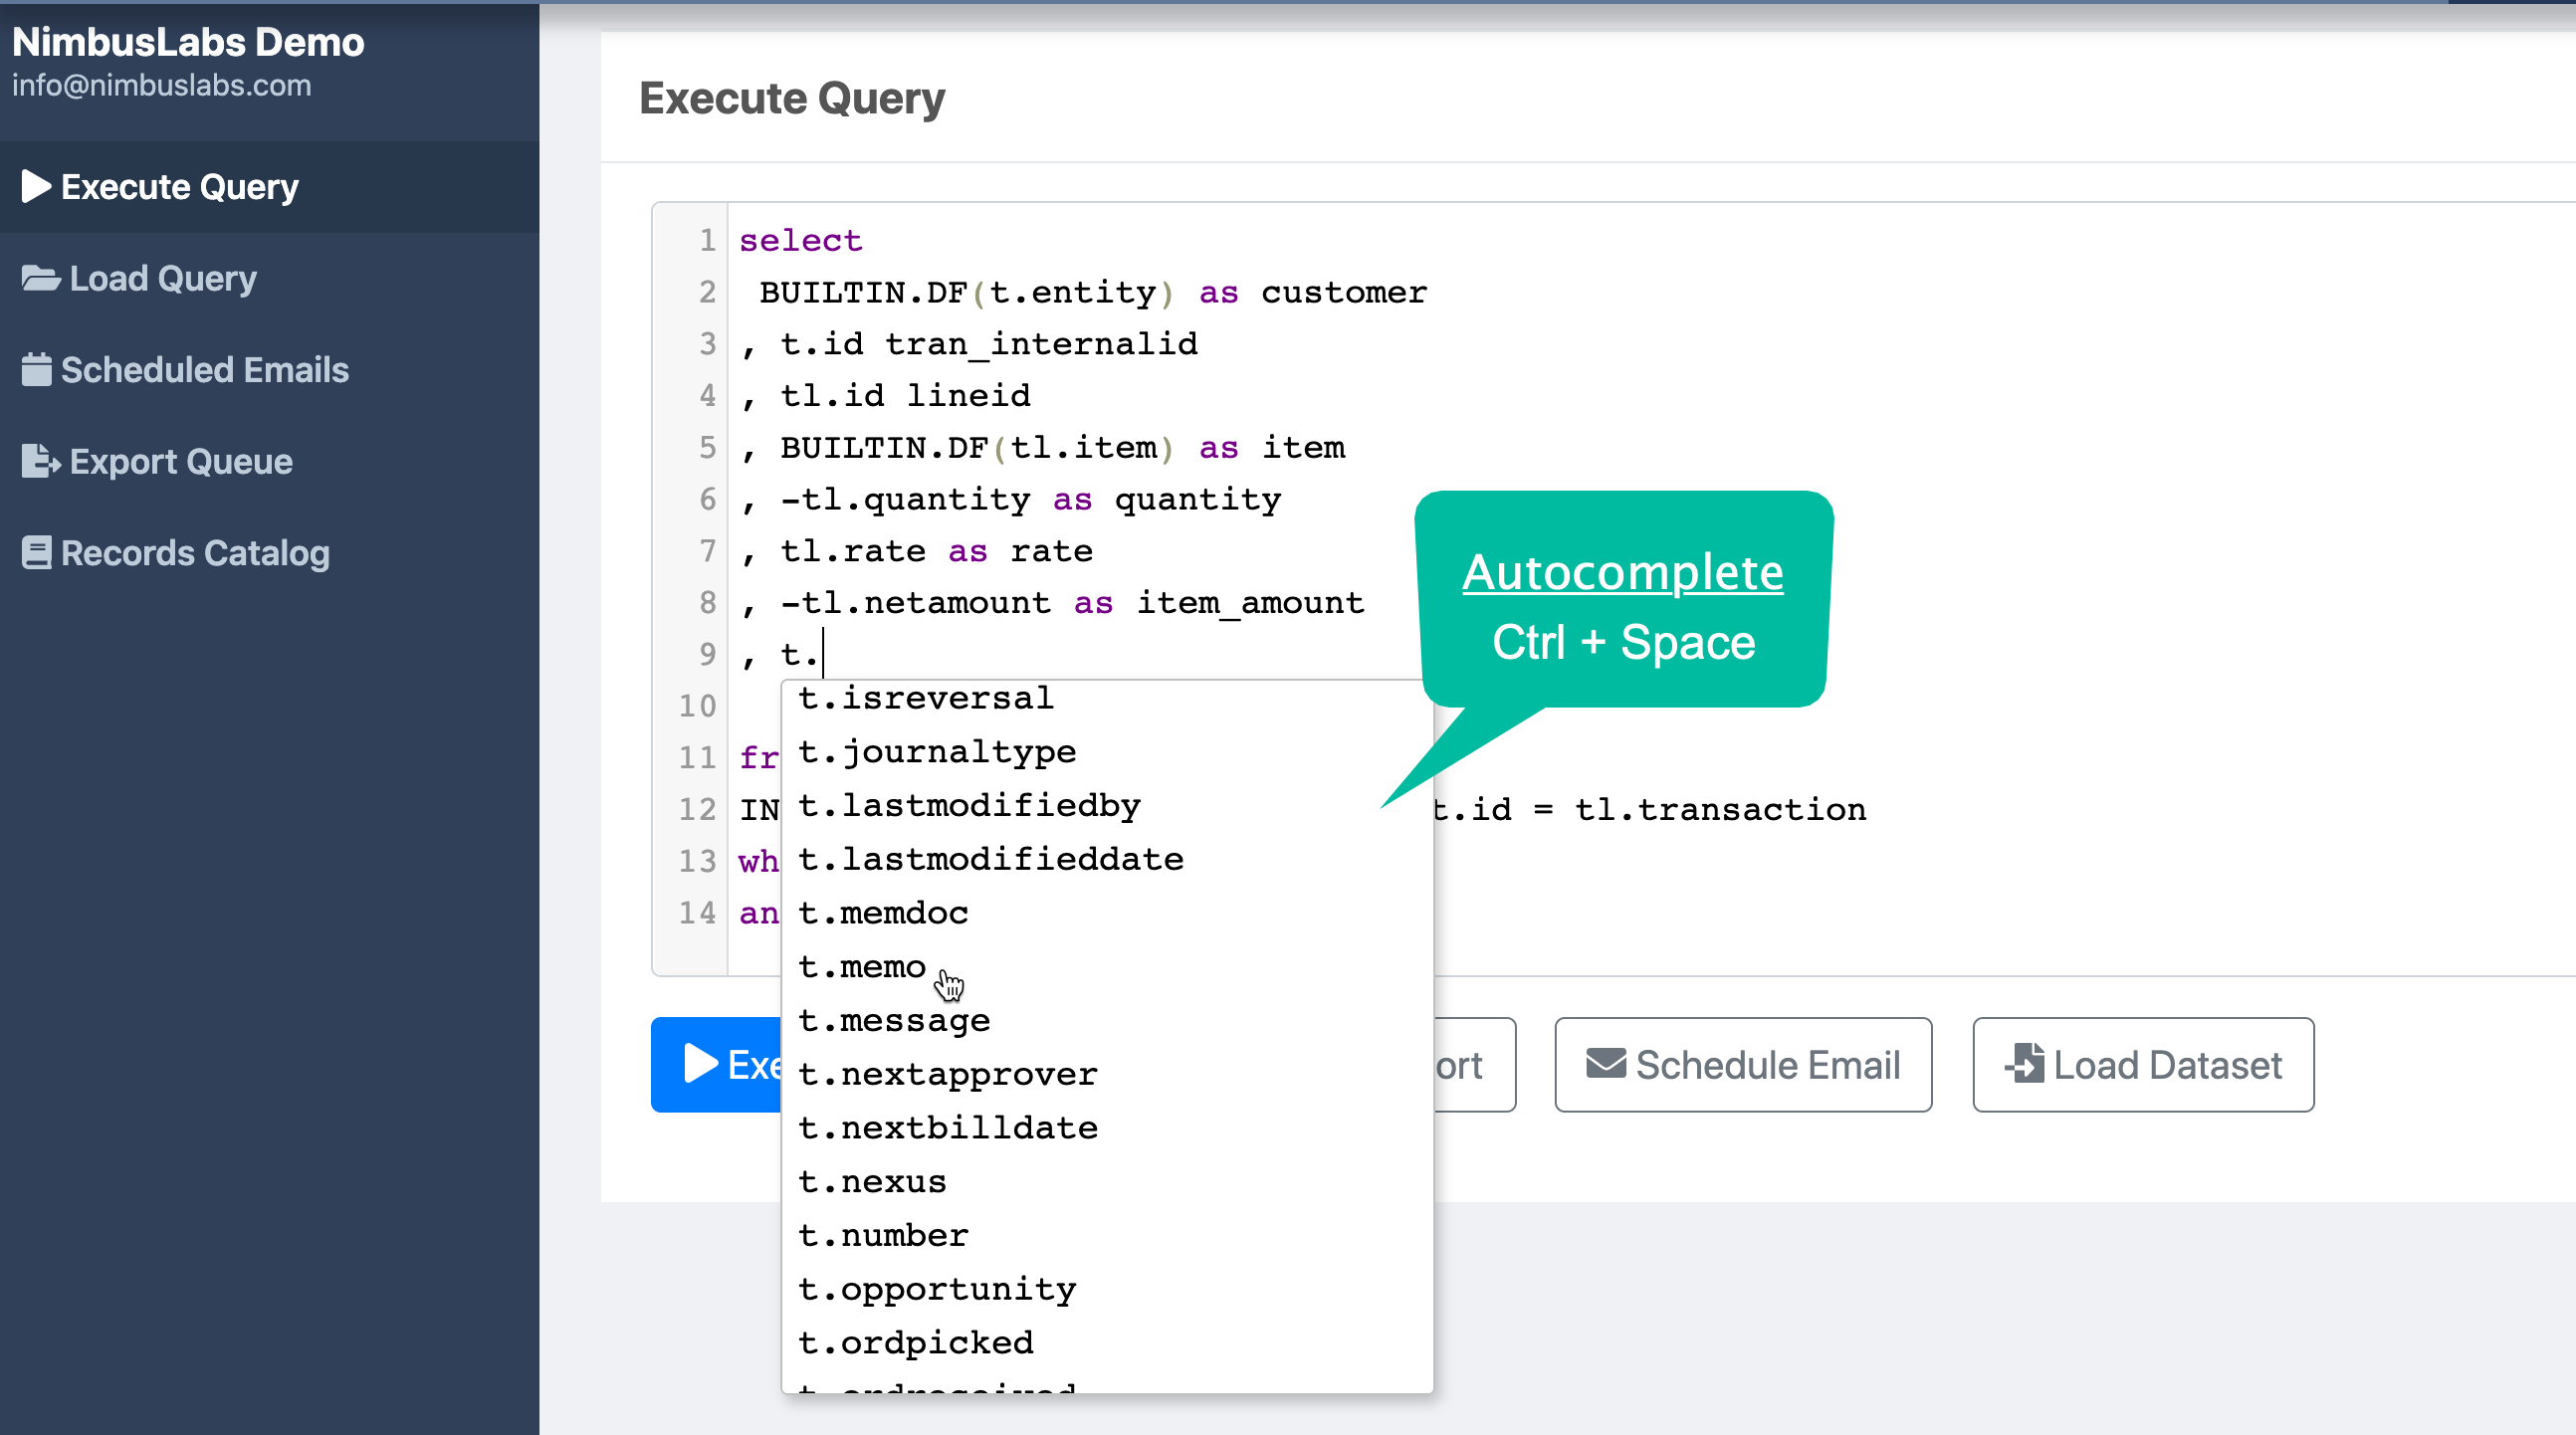
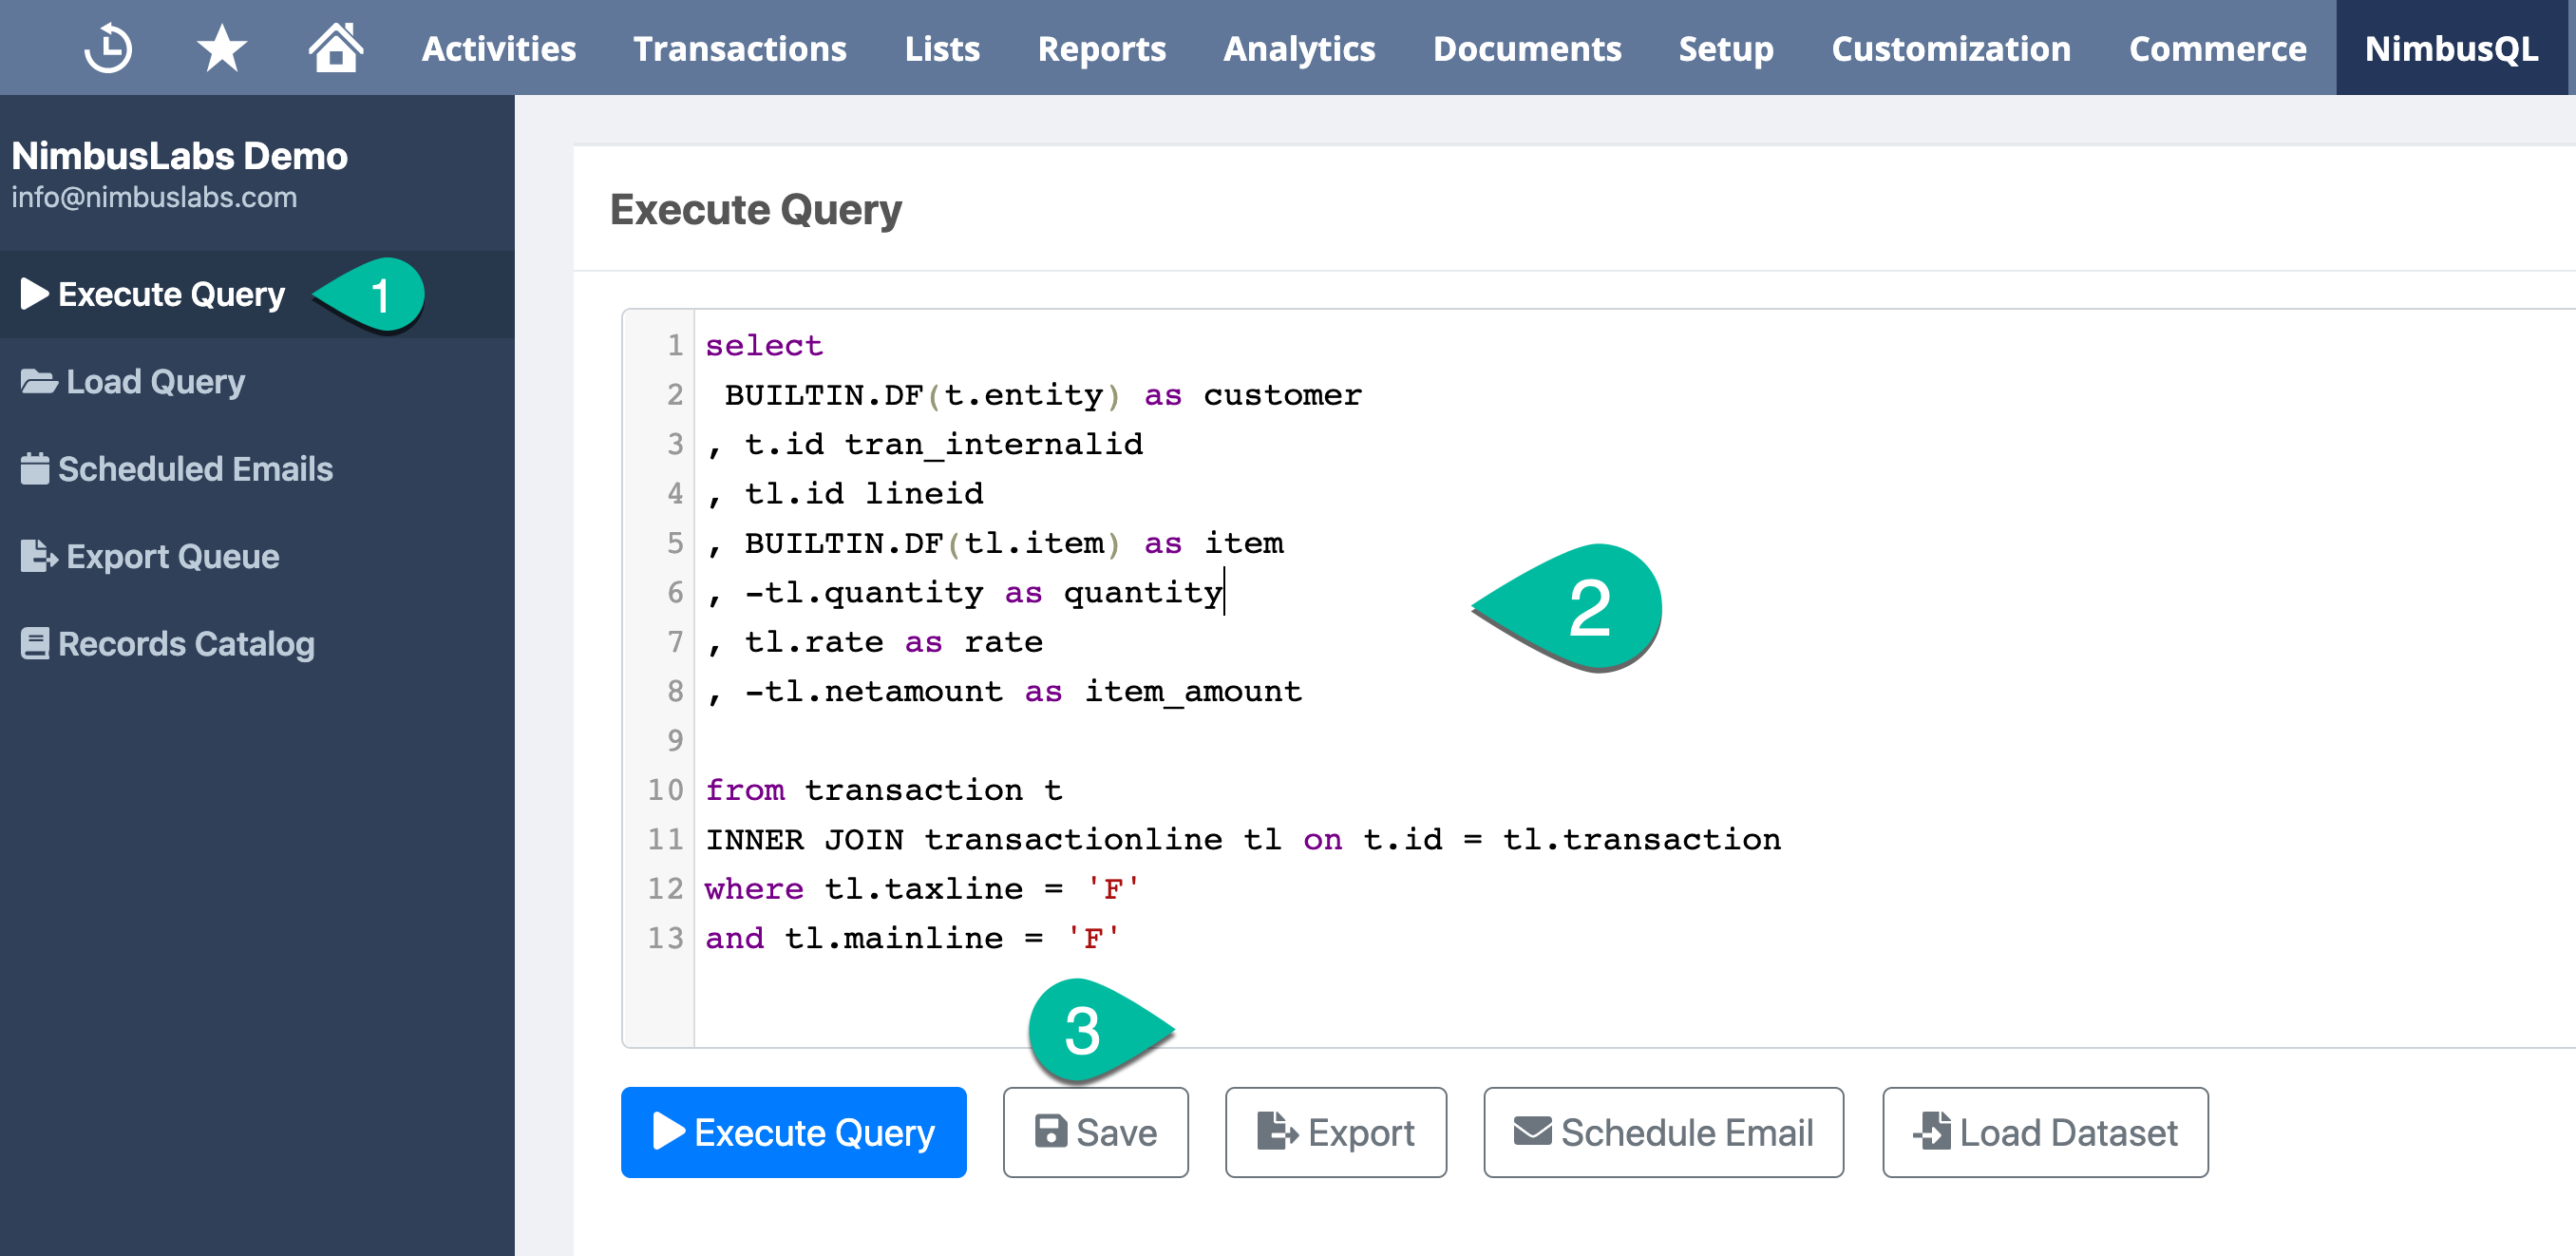
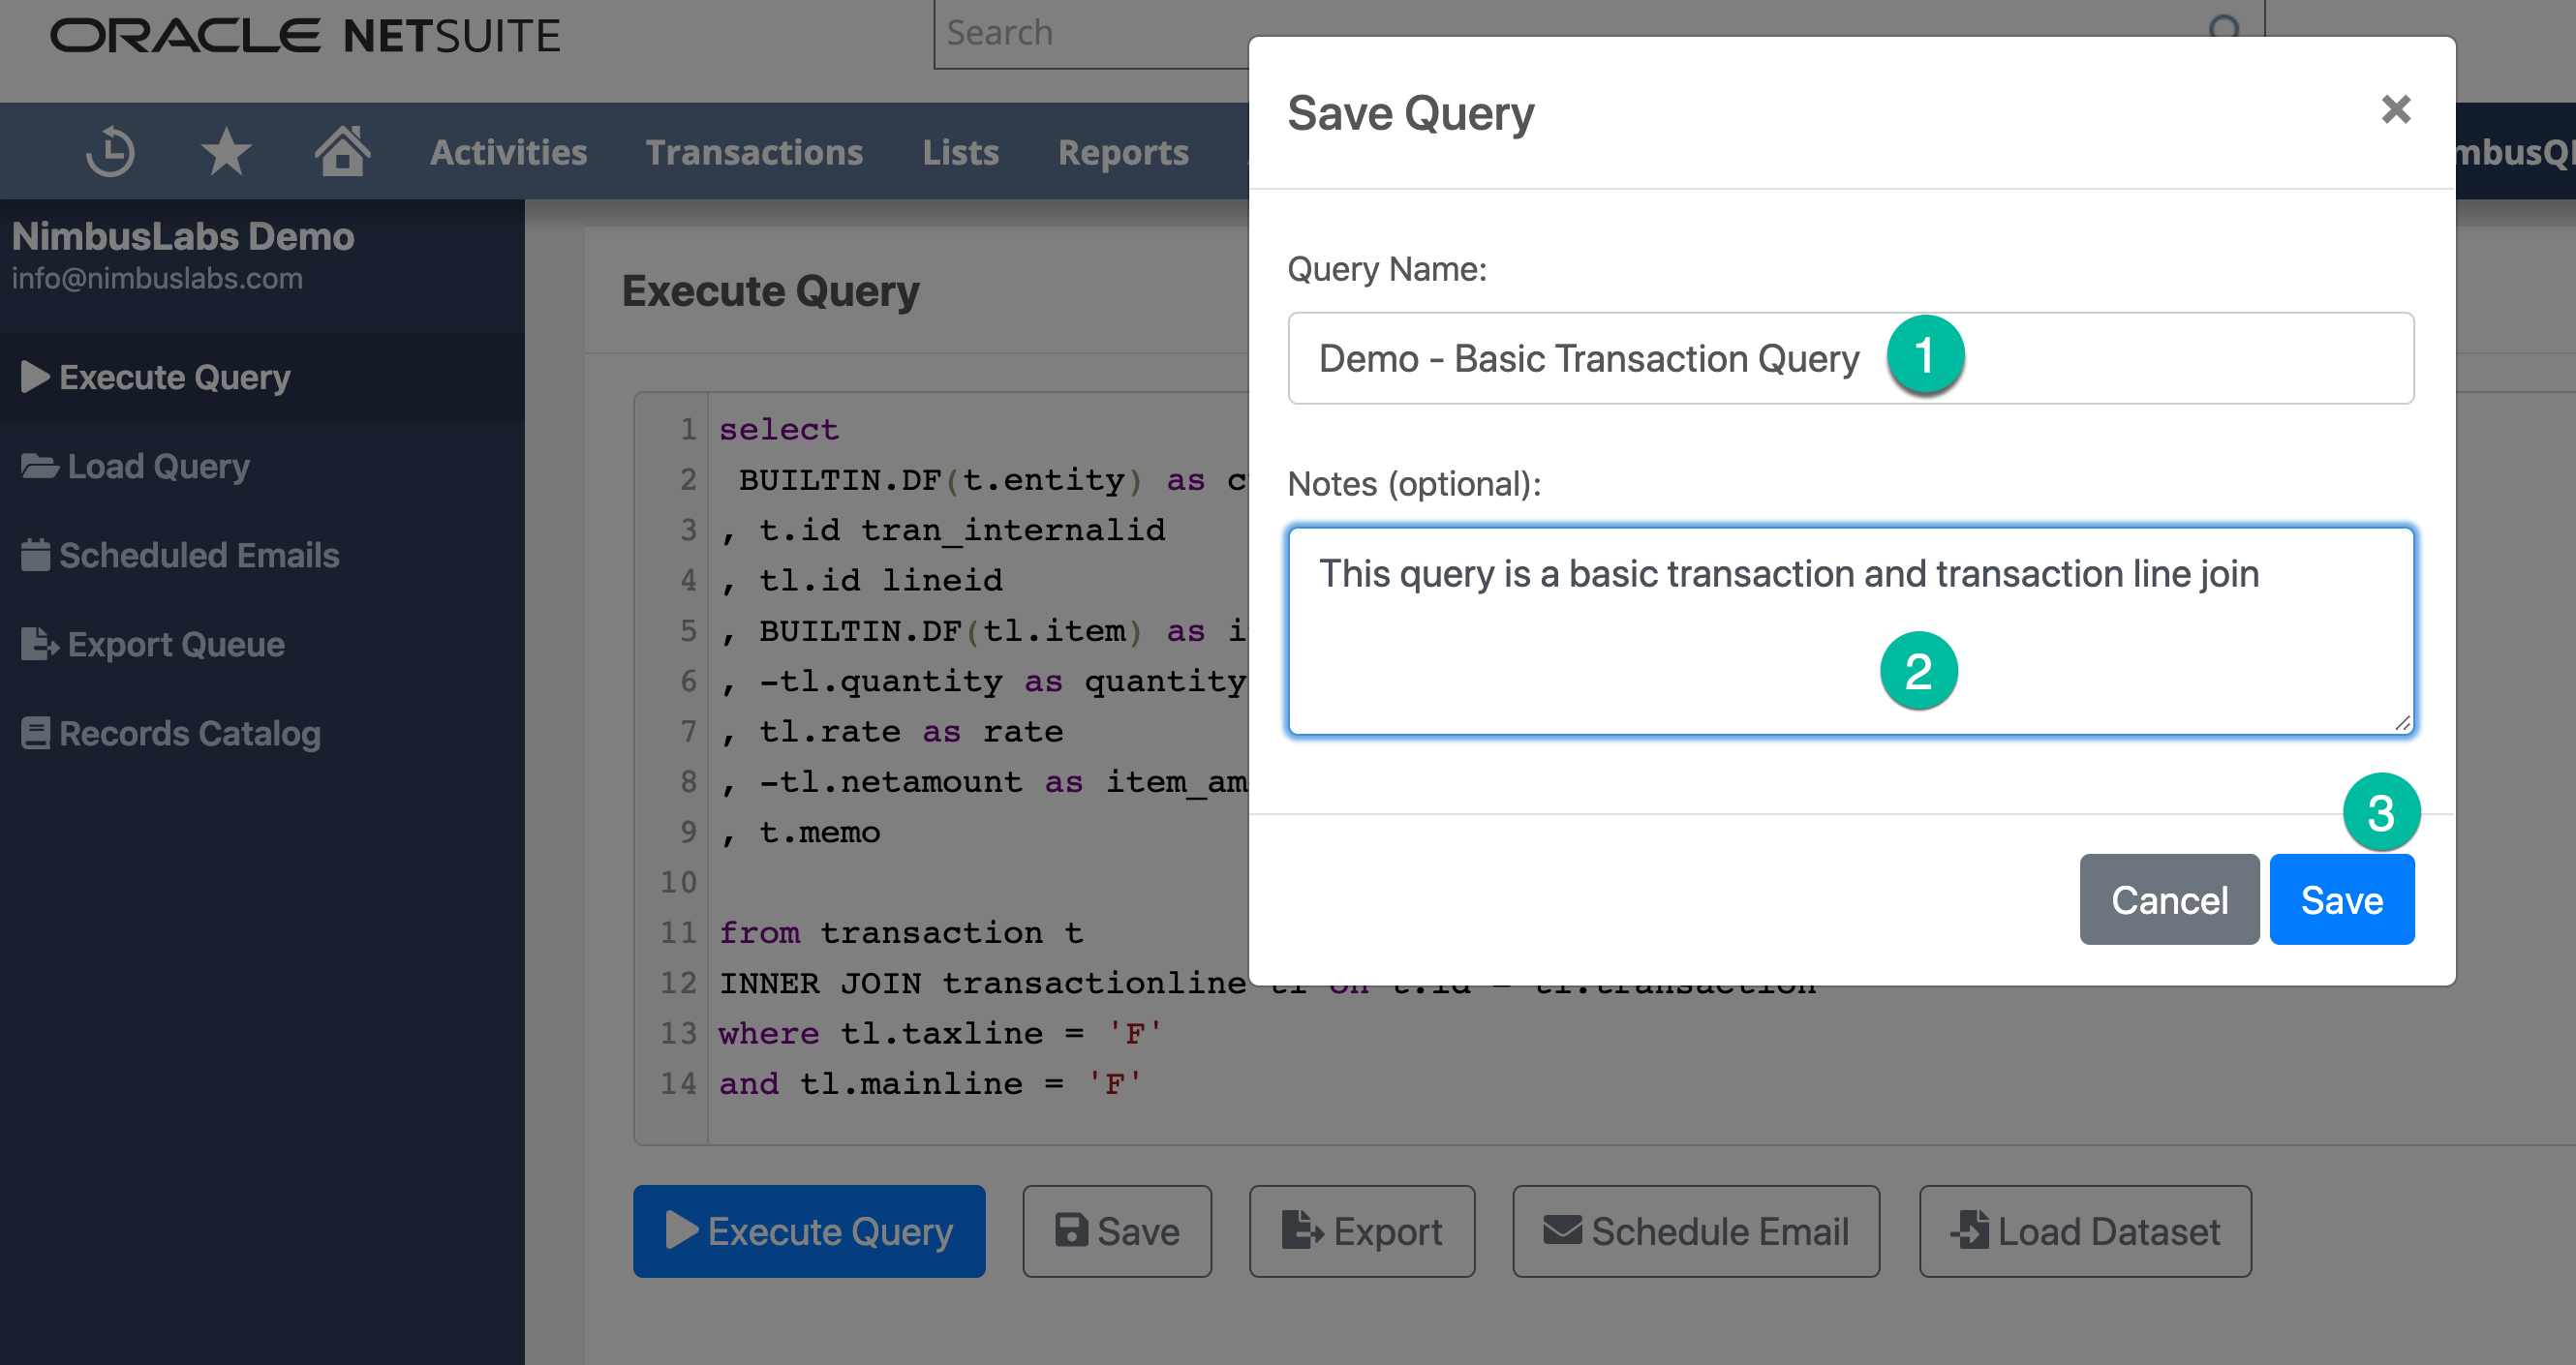
Create a dashboard in minutes, using data from either a saved search or saved SuiteQL query. Add multiple charts across 25+ chart types on the same dashboard, allowing multiple points of analysis on the same screen. Customize the chart look-and-feel, using 10 preset color schemes and a host of options for titles, size, fonts, and other chart presentation options.
Easy-to-Build Dashboards
Create a dashboard in minutes, using data from either a saved search or saved SuiteQL query. Add multiple charts across 25+ chart types on the same dashboard, allowing multiple points of analysis on the same screen. Customize the chart look-and-feel, using 10 preset color schemes and a host of options for titles, size, fonts, and other chart presentation options.

With NimbusDash, you can:
With NimbusDash, you can:
Features
Save pre-filtered views on each dashboard to apply sets of filters with a single click. Quickly cycle through these views to evaluate metrics without needing to create multiple dashboards for the same data sets.
The grid displays all of the data used for the dashboard. Data is stored in memory which results in lightning-fast data analysis and charting. Column pinning/freezing, filtering, row grouping, multi-column sorting, views, and more make analyzing data simple and efficient.
For Excel-equivalent pivot tables, use pivot mode to analyze data across grouped columns and rows. Charts can also be created from pivot mode, either ad-hoc or as part of the dashboard.